
NQ Futures Weekly Range Market Wizardry
I say some things in there that are very noteworthy in relation to the weekly range.
Date: 2026-07-17
URL: https://youtu.be/NPU4gsM9jqA?si=bg4EJUGdqNgZkwTN
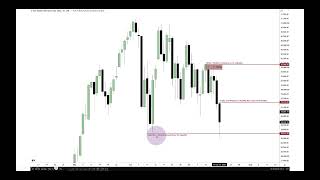
This is the daily chart.
It’s naked.
So we’re going to stretch this out a little bit, and I’m highlighting this suspension block.
You see that?
So that suspension block was a framework for my initial sit-down with Caleb on Monday.
If you haven’t watched that video, or if you didn’t really take notes, go back and listen to that.
I say some things in there that are very noteworthy in relation to the weekly range.
You missed it the first time, guaranteed.
You didn’t catch it the first time you watched it, but you’ll swear up and down that I edited it and added something to it after the fact.
And there’s no way I can do that because it’s time- and date-stamped on YouTube.
So what I was explaining to my son on Monday, I said, you know, this inefficiency in here, when we start the week—and that’s going to be right here, that’s Monday—okay, when we start there, we’re inside the middle of this inefficiency, which is a bullish buy-side imbalance, sell-side inefficiency, but specifically a suspension block because there’s a volume imbalance at the high and a volume imbalance at the low.
All right, so what I’m going to try to do is flesh out a reason for Caleb and anyone else that’s willing to pay attention this week.
Every single day, outlining how we’re going to draw down into that.
Now right away, some of you are going to say, “Well, wait a minute. I was watching some of those videos, and you really didn’t mention that until this day on Wednesday going into Thursday.”
Did I?
Go back to Monday and you’ll hear me talk about how this range, we are opening up with a New Week Opening Gap in a premium portion of this suspension block.
Okay, so if price is bearish and we went lower, we’re trading back up in.
It’s reasonable, it’s reasonable for price to trade up into that on Friday of last week.
And then open on Monday—or Sunday, however you want to look at it—lower than where we closed on Friday.
So we have a New Week Opening Gap.
Now this is in a premium relative to this imbalance.
We are already likely to move lower.
So look at some of the characteristics and signatures of price action here.
We had this high.
We tried to rally higher here.
We tried to rally higher there and failed.
We tried one more time and failed.
How many times did it try to go higher?
Multiple, right?
One, two, three, four.
And now we’re opening up right here in the premium side of this buy-side imbalance, sell-side inefficiency, or suspension block.
If we’re bearish, this is going to act like an inversion fair value gap.
Now, I said to my son in Monday’s lecture that this was the draw for the week.
This is what we’re looking for.
Wait a minute now—if that’s where we’re looking for price to get up into, that kind of limits the upside, doesn’t it?
Sure it does.
But if that’s where we’re focusing on the upside from a premium perspective, well, that kind of points us to lower prices, right?
What are we going to do there?
Well, we were looking at that wick and its consequent encroachment.
We’d like to see it gravitate below that.
If it does, we’ll likely see continuation.
And I also talked about several things regarding specific days of the week and how they should trade versus other days of the week.
And I’ll get to that in a couple more minutes.
But eventually, getting down to here.
All right, so if we stretch this out, that’s the New Week Opening Gap in here.
We have another suspension block.
It’s a buy-side imbalance, sell-side inefficiency with a very small volume imbalance at the high and a very small volume imbalance at the low.
Now, initially, I didn’t care so much about that volume imbalance at the high because I wanted to see how far it would want to stretch down in there on Monday.
And it went right down into this volume imbalance.
I said, “Okay, it could drop down into this volume imbalance and come right back up into the New Week Opening Gap.”
And that’s exactly what she did.
So this suspension block here, we’re splitting that in half here.
So on Monday, we have price trade down into that lower volume imbalance and then right back up into the New Week Opening Gap.
And we got it.
But here, look what it does.
It goes up into that on Wednesday with just a wick.
It can’t overcome the New Week Opening Gap, and it leaves the body lower than where the open was.
So I indicated to you all on Wednesday, I said that, you know, we’re likely to see it go lower.
I told you on Monday, I said, you know, Monday, Tuesday, and Wednesday are going to be a little bit more difficult for someone who’s brand new.
And I don’t expect a brand-new student to be able to navigate that very well because we had CPI and PPI.
Then, after Wednesday’s PM session, things should get really easy, which means low-resistance liquidity run conditions.
That means very easy directional runs.
It’s just as simple and easy as it could possibly be in trading.
And that’s what I’m trying to teach you to identify.
Okay, so we’re in a premium.
We’re showing a willingness to repel away from that New Week Opening Gap.
It can’t overcome it.
And we already did the Monday, Tuesday, and Wednesday hardest portion of the week.
Inside this day right here, we have a wick, and we close lower than its consequent encroachment.
So the open is right at that level, and I mentioned how this is salient.
We want to see price stay out of the upper portion of this wick.
Once we had this close like that, that means I’m telling you it’s going to go lower.
But it could trade up into that consequent encroachment because it’s a premium array.
We opened here on Thursday, traded up toward it, but didn’t even touch the consequent encroachment of that wick, which is wonderful.
Is that bullish or bearish?
Order flow, as I teach it visually from an open, high, low, and close candlestick—it’s weak.
It’s bearish.
It can’t even touch it on a day I told you it was going to go lower.
Okay, we don’t want any bodies above that wick’s halfway point, or consequent encroachment.
It’s a premium wick because price is opening lower than this wick’s consequent encroachment.
It’s a defining marker.
It delineates where price is not allowed to go.
It fails to get to that point or higher and works its way lower.
We want to see this wick’s consequent encroachment.
We want to see it trade through that.
It does.
Consequent encroachment of this wick.
It does.
We now want to try to get down into this candlestick’s consequent encroachment.
It trades through it here, which bodes well for continuation into Friday.
Okay, and then the sell-side below that would be a draw.
And then if we get momentum building below here, it could be within the realm of possibility to get down here and take these relative equal lows.
So in reality, what I showed was this entire week.
Starting on Monday, I said this was the draw for the week: the New Week Opening Gap.
Well, that was when price was going down into the daily suspension block, the lower volume imbalance.
And then I walked you forward each day, building all the evidence suggesting that we would go down to that level here.
So in my mind, this is what I was seeing before the market ever started trading.
We would go up here to go down there.
There’s no data there.
You see that?
None of your gimmicks were there yet on the chart.
None of it had started trading yet, hillbillies.
This is what the Inner Circle Trader saw, and this is what I fleshed out every single day in front of you.
Every single day, 100% documented before the fact.
There is nothing like this anywhere else.
Okay, all you have to do is put the time in and stop listening to these broke people who have no clue what they’re talking about.
So with this in mind, we can see the other part of the expression for this week was that Monday, Tuesday, and Wednesday were going to be the most difficult days of trading.
If you’re brand new, you’re going to struggle a little bit with that, and it’s okay.
That’s normal.
There was a CPI number.
There was a PPI number on Wednesday.
But I told you all on Wednesday…
That trading would get really nice after Wednesday’s PM session.
So what does that mean?
Well, overnight Wednesday into Thursday, it would be easy trading.
Thursday’s session.
Friday’s session.
So here’s Thursday’s low-resistance liquidity run condition moving where?
Lower, because this was the draw on liquidity on the upside.
So Thursday delivers low-resistance liquidity run conditions.
It’s a real nice expansion, a big-range candle moving lower.
And then Friday does the same bit of business, right down into the daily relative equal lows.
That’s what the RELs stand for.
And that’s the weekly discount draw on liquidity.
So this New Week Opening Gap is the weekly premium draw on liquidity, and that’s the discount draw on liquidity for the week.
So what am I basically telling you?
What you already thought, and I haven’t said it yet.
I outlined the entire weekly range beforehand.
How about that?
In a very complex market condition, all from a daily chart—no smaller timeframes.
Okay, you see all these guys?
They want to have higher-timeframe talks.
They want to get out of the 1-minute chart.
They think that’s the only thing I do.
I’m in every timeframe.
I’m the ghost with the most, baby.
I’m everywhere.
Once you find your model, you’re not supposed to be hanging around with me.
You’re supposed to be doing your own thing.
But I’m talking to students who haven’t made it yet.
That’s who my audience is.
I’m not talking to charter members.
Charter members are already down the road.
They’re already doing their own thing.
If there are charter members who haven’t found their model yet, there are a few of them.
They’re here learning just like you are.
They’re getting a little bit more detail, a little bit more subtlety and nuance, and it’s helping refine their concerns, their doubts, and their lack of confidence.
And lack of confidence is a very hindering aspect of trading because money scares people very quickly.
It’s a very enticing thing.
It gets people interested.
That’s why you’re watching me, after all.
I’m not all that terribly interesting, right?
But the fact that I can tell you where these candlesticks are going to go, how they’re going to walk, breathe, and print, way before they actually do it, and before anybody else’s little gimmicks and toys ever start talking about what could happen.
Here is also the aspect of the weekly range I teach, which is TGIF—Thank God It’s Friday.
Just look up TGIF on my YouTube channel: https://youtu.be/wTR-vhOdMgo?si=sluzp8dW93tTYRdv
If we measure from the high of the week that formed on Wednesday down to Friday’s low, once it pierced this and worked its way back above that low, how far can it retrace?
Twenty to thirty percent of the weekly range.
The 20% level is here.
The 30% level is here.
Look where we closed for the week—right in there.
That’s pretty simple, isn’t it?
Pretty neat.
You’re forecasting where the close of the week is going to be.
All right, so we can drop down into a 1-hour chart.
You watched me take a trade and execute on it, and I highlighted and brought your attention to this buy-side imbalance, sell-side inefficiency.
And I have a lecture that talks about why I chose that, so I won’t take up your time with that.
But we drew down into that consequent encroachment.
I took some profits there and got stopped out on the final single contract.
And then I told you that boded well for continuation lower.
We worked lower.
There’s our smaller, short-term minor sell-side liquidity pool, which is not highlighted here, but that’s one of them.
And then we broke lower and eventually got down through that daily relative equal low at 28,512, rather.
And then you can see where we settled inside of TGIF.
Moving into a 5-minute chart, just to get a little more flesh on the bone.
Here’s the New Week Opening Gap.
We broke lower, traded down into that 1-hour buy-side imbalance, sell-side inefficiency, then rallied up and created the good old Market Maker Sell Model.
Smart Money Reversal.
Original consolidation.
First-stage distribution.
Second-stage distribution.
The biggest part of the run, right to the weekly target.
Now, if you look at it from this perspective, okay, regular trading hours tend to have gaps.
And what you’re going to have to do is study.
Every week, you should print out your charts like this and keep them.
Then compare and contrast the gaps and the lack of price action between the settlement price at 4:14 p.m. Eastern Time and the new 9:30 a.m. Eastern Time opening.
These gaps and how price prints in them are very important.
But there’s also this mystery that when these gaps form, there are other formations in price action that are seen in electronic trading hours.
Electronic trading hours are basically there to disrupt what you see in regular trading hours.
So it’s like a jigsaw puzzle.
You have different parts, different pieces.
This is one piece.
This is one piece of price action.
This is another piece of price action.
There’s a small little gap right here.
And then we have this piece of price.
Then all of this is one piece, and this is one piece.
But notice that there are pieces missing in here, here, in between here, here, and here.
That’s where electronic trading hours fill in those jigsaw puzzle pieces.
So you have to be able to determine what those pieces look like when you’re looking at Globex trading.
That means when we start trading at 6:00 p.m. Eastern Time at the restart, all the way around the clock until 9:30 a.m. Eastern Time, that puzzle piece gives you more information that does not exist in these gaps.
Many times, electronic trading hours go into these gaps before regular trading hours do at 9:30 a.m. Eastern Time the following day.
And whatever electronic trading hours do, regular trading hours will tend to overlap and redeliver those price runs.
That’s usually what takes place.
That’s why, in the beginning of the 7:00 a.m. to 9:00 a.m. pre-market session, I teach that we look for overnight highs and lows and relative equal highs and lows.
Because they’re going to run them, even though price already traded there and booked overnight.
Regular trading hours are going to run up there or run down below them relatively sharply to get that liquidity, to trip traders who want to trade breakouts, and to trigger the pursuit of yield by algorithms used in investment firms, banks, and by large private traders.
It’s not simply going above relative equal highs to take buy stops.
Okay, it’s not just that.
There are mechanisms used in algorithms that will turn on buy programs once those levels are taken out.
Vice versa, when relative equal lows or a single low are taken out, it’s not simply going down there to take sell-side liquidity or sell stops.
That’s not what’s going on in its entirety.
It’s going down there to stimulate the pursuit of yield in algorithms because they see price give up that level.
So it’s not just who bought, who sold, and how many stops are getting taken.
That’s small-fry logic.
But as a way of teaching and keeping things very simplistic, because in the beginning most of you—and let’s be honest, some of you still don’t believe it—didn’t understand or even believe what the market is in terms of an algorithm.
But now it’s easier for you to understand.
It’s more palatable for you to know what I’m talking about when we’re looking for runs on liquidity.
It’s just an easy way to use an all-encompassing approach to say there’s a whole lot of interest in price getting to that level.
And it’s not just support and resistance.
Because I’m going to the levels that work, the levels that draw price.
You ask anybody who’s trading support and resistance, and they’re going to have 50 different levels that are going to be concerning for them.
Not me.
So let’s wrap this up here.
1-minute chart.
This is what I was giving a lecture on this morning, okay?
I gave you eight minutes of very specific, succinct information regarding when you have relative equal highs, which we have right here.
See that?
Relative equal highs.
And we’re running up into the beginning of 7:00 a.m.
If you’re looking to trade from 7:00 a.m. to 9:00 a.m., which is the pre-market session, and you see these types of settings here, just because it has these smooth highs up here and we’re approaching 7:00, it doesn’t mean that it’s going to go right up here and punch through them.
It could, but what’s more likely?
To get down to the higher-timeframe draw on liquidity, which is those relative equal lows at 28,512 on the daily chart, given to you in advance.
Yes, it’ll cover from 7:00.
Look how fast it starts running.
Here it is, 7:00—boom.
It starts ripping, ripping, ripping, ripping.
And then at the 9:30 opening bell, we get a little bit of a Judas swing here, and it can’t even take that buy-side.
Why?
Because it wants to go where it’s been aiming all week long, where good old ICT himself told you: 28,512, the daily relative equal lows.
That’s the winner on the downside.
Remember, I capped the weekly range in commentary on Monday.
That’s the draw on the week.
Wait a minute now, you’re trying to tell—
Yes, that’s exactly what I’m telling you.
I knew we were going to take out these relative equal lows in advance, and I left all the clues for you to follow.
Go back and listen to all the logic I was giving you, because it’s inescapable.
Everything I say is calculated.
Everything I say has a purpose.
You can’t escape it.
So the point of this morning’s eight-minute lecture was this:
If you’re trading between these two times—7:00 a.m. and 9:00 a.m. Eastern Time…
If we’re real close to running what looks like relative equal highs, but we haven’t finished the week’s business down here at that draw on liquidity, don’t think it needs to go up there first.
It only has today—Friday.
It only has Friday to get down there.
And what rocket fuel is it going to use?
The start of the pre-market session at 7:00.
Run down and gain a lot of the ground needed to take out that low.
We go right to this little bit of a low, then rally up with a Judas swing, and then they dump it aggressively below 28,512.
They accumulate all of the interest for trailed stop-losses and put people offside.
Algorithms are now systematically chasing sell programs.
They want to be bearish.
They want to sell short.
And then the market rips higher, gets back above the low at 28,512, and gets back above this low.
So what have we done?
We’ve cleared two pools of liquidity here.
Now, if you look inside this area here, this SIBI becomes an inversion fair value gap.
You see it getting the low here, right there.
You can use your own charts.
Rallies up, and then it goes for the buy-side.
Then it trades back to the inefficiency that was a fair value gap over here.
Just look at this morning’s lecture. You’ll see what that is.
And the point of me mentioning Friday’s midnight Eastern Time opening price was this:
You would think that, with relative equal highs here, it’s likely to go up there, trade above the midnight opening price, and then go down to Michael’s target.
Not when it’s Friday.
Not when it only has a little bit of time left.
It needs to use the chaos, the rocket fuel, and the volatility of session opens.
Pre-market session, 7:00.
I mean, look at that, folks.
That’s brilliant, isn’t it?
Nobody was teaching that stuff before me.
It trades lower, and then at the 9:00 session close, we get a little bit of a drift.
And then one more time, a Judas swing at 9:30 pulls the rug.
The elevator careens lower, takes out all of the levels that would have any liquidity there, and then some, just to get folks thinking it’s going to keep going lower.
And then massive short covering, because I had everybody on the internet who was trading NQ focusing on this level right here.
And you don’t think they’re all trying to take their profits?
Of course they are.
But then, and only then, price works its way back to Friday’s midnight Eastern Time opening price, clears it here, and then goes up for another minor buy-side pool.
So there’s that inefficiency there.
Okay, it trades to it here, consequent encroachment.
Then right in here, right where I was giving you the review and teaching you that eight-minute-long lecture about why we don’t look for these relative equal highs between 7:00 and 9:00, because it’s going to the weekly draw, the target I gave you.
You’ve got to think about how much time is left, because time is the most important factor.
You have to consider that it only has Friday.
Because when we close at 5:00 p.m. Eastern Time, that’s it.
Then we go into the weekend, and we have to wait to see what happens on Sunday at 6:00 p.m.
And nobody knows what that’s going to be.
I don’t know that.
I have no idea what happens.
I have to submit myself to where they’re going to open it up.
That’s 100% controlled by them.
No buying or selling pressure has any merit or influence over that.
I say that facetiously because it doesn’t have any bearing on what price is doing, okay?
Price is leading, and then people buy or sell while chasing it.
It’s not being bid up like you think.
You think, “Oh, it’s this, it’s that, it’s auction market theory.”
No, no, no, no, no, no, no, no.
It’s going to a level and stopping because it was already predetermined.
And if you can’t see that from the old man now, you’re lost.
You’re lost.
And if you can’t subscribe to what I’m teaching and what I’m presenting as fact, don’t waste any time with my videos.
Don’t watch anything.
Don’t even be a part of this community as a spectator, just watching and observing.
Because the only thing that’s going to happen is I’m going to hurt your feelings, and that’s really not what I’m trying to do.
But the market then clears that buy-side here, trades back down below Friday’s midnight opening price, and then we settle into TGIF, between 20% and 30% of the weekly range, and close right there.
Brilliant, isn’t it?
Now, if you had paid attention every single day of the week to the lectures and the things I said about price action and where it was going to go, and then blended in what I taught in this morning’s eight-minute video, it’s very simple and easy to understand.
Don’t expect these relative equal highs to be taken before the draw on liquidity, because it’s Friday.
It’s Friday, folks.
It only has a little bit of time.
And notice that the flurry of activity is at the session openings here.
And as soon as it makes the run to where we thought it was going to go, look at the momentum that comes into the marketplace.
This right here, that’s not buying pressure, okay?
That’s not what that is.
It’s not selling pressure evaporating.
It printed there, and now it’s going to quickly run for the liquidity here because they don’t want to give them an opportunity to pull their orders.
That’s why you see it moving with that speed.
It’s quickly getting up to here.
And then we have a retracement.
And like I told you in this morning’s eight-minute lecture, I would personally be done with the week because it has already done everything.
Notice it didn’t go any lower.
And who cares if it goes back to the midnight opening price?
Who cares?
It’s not going to go up there and then go lower.
And you heard me say that, and it didn’t.
It went up there and took buy-side, and then we went right back between the low that I told you it would be done at and this high.
There you go.
Big deal.
It’s going where I taught you it would go: TGIF, a 20% to 30% retracement of the weekly range on Friday.
Bang.
Done.
Handled.
In the books.
Loading post from X…
A preserved copy is ready if the original cannot load.
Keep learning with us.
Get new ICT lessons, study notes and updates as we build V2.