
Trade Explanation AM Session & Hangman PD Array 07\16\2026
We have this sell-side liquidity, and look at these relative equal lows here.
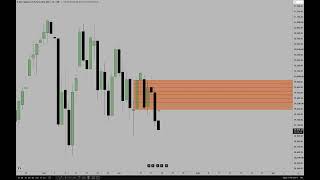
Date: 2026-07-16
URL: https://youtu.be/Dj0663u7VRc?si=HIffJ3AvAJi1nmiA
Loading post from X…
A preserved copy is ready if the original cannot load.
All right, so here’s the daily chart.
And as you may recall, if you kept notes in the lecture I gave yesterday, I mentioned how we were likely to continue going lower because we had this volume imbalance right here.
We closed down below that, so that really bolsters the idea of seeing lower prices.
We have this sell-side liquidity, and look at these relative equal lows here.
So keeping, I guess, the idea that we could eventually gravitate below that low warrants at least some focus there for tomorrow.
But it is Friday, so just be mindful of that.
And if we pick up momentum below here, this is what we’ll likely get.
And if it doesn’t get down there, but we get significantly below this low, we could get a gap lower opening on Sunday that may see it go below here.
So it’s just a couple of scenarios in concert with what I’ve outlined for this week and what we said we would likely see yesterday.
So let’s add some lipstick on here.
We had this area over here, and notice that on Wednesday we opened and swept above its consequent encroachment.
The wick goes above it, but the body—we close down right here.
Then we open, trade up into it there, and break down.
Now, we were inside of this here.
So as I’ve talked about ad nauseam over the years while teaching, the surest sign of probability being high is if you have something that’s anchored to a weekly chart or a daily chart—some key level, some specific draw on liquidity where the market may be pulled to.
And by having that anchored to one of those two timeframes—that again being the weekly and/or, at the very minimum, the daily—you can’t really say that you have high probability behind your idea.
That’s my opinion.
So by having the movement below this wick here, look where we’re at.
Okay, so here is consequent encroachment of that.
We’re below that now, so it looks like we could potentially get down here.
Now, the only way this changes to bullish for me is we have to take out the open on this candlestick yesterday.
I’m going to drop down into an hourly chart, and I’ll show you something.
All right, so we have that secondary inefficiency that isn’t shaded in that dark red.
I changed it by contrast.
So now you can see this is what we’re looking at here, and it’s being applied to the hourly chart.
And right here—right there—you see that?
That candlestick’s high, that candlestick’s low.
That buy-side imbalance, sell-side inefficiency is from Wednesday at noon Eastern Time.
You see that?
We gravitated down into that here, and then retraced back up again, and now we’re down here.
Okay, so just pay attention to the old man.
The old man’s trying to keep you straight and narrow.
I told you yesterday we were going to go lower.
Okay, so when I popped online, I saw that we had already run up here with a Judas swing.
Right here is the 9:30 candle, right there.
Okay, so there’s the 9:30 open.
We rally up, and we’re hitting a level that is kind of obvious if you’re looking at imbalances and inefficiencies and you grade them the way I teach.
But if you look at it from this perspective, we have that line right there.
Follow that along.
Hey, see it?
See what it’s doing here?
See that right there?
So now we’re left with the low of the inefficiency on the daily chart.
Then we have an octant, and then we have the lower quadrant.
And it trades right up into that.
Isn’t that interesting?
That’s the high of the day.
See how we worked overnight?
1 o’clock in the morning, 1:30 in the morning, we’re up in here in the upper half of the darker shaded one.
I’m going to just highlight this so you can see it.
Okay, and then we worked aggressively lower.
And then once we left this one there, we were just using it as kind of like a premium array.
But then we had to blend this upper range.
Okay, this is a shadow, where it’s a blending of two inefficiencies, which I just taught, I believe, last week.
Now we’re going to take it off.
Now it’s the lower one on the daily chart.
So when you all ask me, what’s on your pad?
Can you show us your notepad?
What are the levels you’re looking for?
All those types of things are like this, and the quadrant levels and the octants.
And I may have a little notation as to what time a very key octant or quadrant level formed.
And then I use that information when I’m watching live price action.
So I can look at a naked chart and just glance at my notepad and say, okay, I’m heading toward this particular octant.
I’m heading for this particular quadrant of an inefficiency, or an old pool of liquidity, or an old daily high, or old session low—something to that effect.
We gyrated around in here, around the consequent encroachment of the lower daily inefficiency.
That’s this one that’s shaded here.
And we rallied up.
We failed to get to the upper quadrant, worked lower, failed to get to consequent encroachment there, traded down, and then we had this rally up.
This is that 9:30 open, okay?
And it hit the lower quadrant of that daily inefficiency, okay?
It’s because it was formed—its original utilization was a buy-side imbalance, sell-side inefficiency in the form of a suspension block.
So its characteristic is, if the market was bullish when it traded down into it on the daily chart, it should propel price higher.
But we’ve wilted and went through the lower end of it.
Okay, so we’re in the lower thresholds of that, and we’re trying one more time to mount an opportunity to go higher, but it fails to do so.
At 9:30, hit it.
I would have shorted that right there on first touch of that.
We get the first displacement below that low, and this is the first presented fair value gap.
Its first utilization is what?
Bearish.
So if it comes up into that—we were banging around in here, going crazy—and when we get closer to the 11:30 time right here, this is where a lunch macro tends to have a strong effect.
And you’ll see the pullback into a higher low that formed at 10 o’clock.
I annotated it, showing you what it was anchored to and where it came from.
That’s Wednesday’s—or yesterday’s—2:00 p.m. Eastern Time 60-minute, or 1-hour, buy-side imbalance, sell-side inefficiency.
So I’m framing two points of reference: premium, which was the lower quadrant of the daily suspension block, and then down here.
See how we close this a little bit below the midpoint line?
The market then traded back up through and back up into the first presented fair value gap.
It spent a little bit of time in here.
This is time distortion.
And then we wait for this false run here.
It’s going to go up here where these highs are.
It’s going to take out the 9:30 high.
Okay, everybody in retail chat at this moment was saying it was going to go higher.
I posted that 29,538 buy-side is suspect. (don’t know where he posted that, maybe his student’s livestream chat cause there is no such tweet or telegram or youtube post)
So it’s not likely, even though you see it as relative equal highs on the chart like that, it doesn’t mean it’s going to go there.
Why?
Because the market’s weighted. It’s going to be heavy, okay?
And this is all outside the scope of this fair value gap that’s bearish.
So how do you get back in sync with it?
We’ve got to give it a chance to take out buy-side here.
And then once we close below it again, that resets first utilization.
That’s the part where you write that down, folks.
Okay, first utilization is when a PD array forms.
We went below this low.
It displaces below that low.
That validates this as a bearish breaker.
We’re coloring outside the lines.
So you don’t do anything with this inefficiency because we’re bearish.
I told you yesterday we’re going lower.
So this has to be recalibrated to swing back in sync with looking for lower prices off of it and acting as a premium array.
The way you get that information and validate it is you have to submit yourself to time and wait for a close below it, like it does here, after it takes a short-term pool of liquidity that’s opposing it.
What would that be?
That’s this high here.
So that’s a Turtle Soup.
It validates this and puts it right back in sync, as in play.
It’s going to be used as a premium array.
This is a Mohawk.
We already know that that’s permissible, but look what’s going on.
We’re going up in here.
We got a little bit of body above the midpoint, and then we get this little bit of wick.
As soon as it does that, when you see these candlesticks right here, it’s the same thing that’s occurring down here.
See how the bodies were just below consequent encroachment of the 1-hour BISI?
We wicked down through these candles that were just below consequent encroachment.
When you get this and it becomes a wick and reverses like that, usually it’s a pretty significant run.
Same thing’s happening here.
Bodies just above consequent encroachment, and then we wick above it and move outside of it again.
Guess what that means?
It’s going to go lower.
And we see it do that.
We moved lower here, validating and setting things back in motion for this to be a valid bearish first presented fair value gap.
We get that wick and rejection away from that.
Okay, so now it’s a done deal.
All things need to stay below consequent encroachment of the first presented fair value gap.
Bodies stay below.
Wicks, that’s fine.
But look what time it’s doing it, when the lunch macro should begin to start pulling back down into what?
A 10 o’clock low.
10 o’clock is there, so there’s your low.
So the lunch macro is going to target this low.
Okay, we get it right there.
Beautiful.
This is a Hangman.
It’s not a gallows, but it’s the same kind of premise where I’m using that thought process of them getting hung.
So anyone that was going long here, they get stung right there.
So they’re getting dropped, the noose is around their neck, and then they’re gone.
And then it reverses.
Same premise here.
The bodies are just above consequent encroachment, which would indicate what?
Continuation is likely.
But then we move back down outside of it, lower.
Why?
Because it doesn’t give it to them.
It just goes up there, wicks past it, and then rejects.
So it’s kind of like the horse being smacked when the guy’s hanging there with his head in the noose, and they say, it’s your time, and smack the back of the horse and it runs away, leaving the guy to hang.
Well, he’s not hanging himself.
He’s being hung.
So that’s the Hangman.
This little wick above, when the criteria is that the bodies are suggesting maybe continuation, but then we get this, then it’s done.
It’s over.
Then in the afternoon, we have the lunch macro.
So 11:30, there you go.
And then the market trades back up into the first presented fair value gap.
The bodies can’t touch consequent encroachment, which is wonderful.
And then we go into that gap again, and it performs the same way.
The bodies can’t escape it, but the wicks are allowed to do the damage straight up into the fair value gap.
It breaks lower, uses the midpoint, or consequent encroachment, of that lower gap, and now we pull down into the 10 o’clock low targeted by the lunch macro.
We went through it and then went lower.
As soon as we have this close below here, again, assuming we don’t get that wick down through it, it’s likely to keep going lower.
We move around in here.
We don’t get any wicks to take that out.
It tries to make an attempt to go higher.
This is all time distortion.
The market trades lower to the low of that 1-hour buy-side imbalance, sell-side inefficiency, and comes right back up into it.
Now look what the bodies are doing.
They’re going to say, oh, it’s going to keep going higher.
It’s going to take these relative equal highs out because they want to be a contrarian.
They’re fighting the higher-timeframe order flow—the real order flow.
And then the bodies are telling you, no, it’s not.
It’s not going to go higher because we wick through this upper quadrant of the 1-hour buy-side imbalance, sell-side inefficiency.
It’s telling you it’s going to go lower.
Remember, the wicks do the damage, but the bodies tell you the real story—the narrative.
The real volume is shown in the bodies, okay?
That’s what the algorithm is designed to do.
That open and close are the two most important prices you’re ever going to have.
Breaks lower, and then we have this buy-side imbalance, sell-side inefficiency.
If price is weak, this should act as an inversion fair value gap.
Well, lo and behold, what do we have right here?
The bodies are stopping below it.
Can’t even get to the midpoint.
Is that bullish or is that bearish, based on what the old man says?
The market breaks down, comes right back up to the low of this inefficiency, and falls out of bed.
Then it comes right back up, touches the low of that inefficiency one more time, and it’s happening at 4 o’clock.
And then we went into this bit of business.
We have the New Day Opening Gap.
Sell-side is right below here.
We went through that.
Relative equal highs formed, broke through, and now we’re down here.
The next bit of business is 28,900.
It could happen, you know, during Asia tonight.
It could do it in London.
It could retrace and come up here, knock out these highs, and then go for it tomorrow morning.
Either way, that’s the next significant pool of liquidity.
If it goes down here, then I’m content.
I’m not interested in looking for anything else or calling anything.
I think I’ve had a really good technical week with you all.
I showed a lot of things, and you watched it come to fruition.
The algorithm is impressive.
The precision is impressive.
The details and the logic that I’m teaching, the language that I’m teaching you, so that you understand what I’m speaking about—once you get that, things will start happening quicker.
And the only way you learn the language is by systematically placing yourself in the lectures, listening and watching me cover it, because the logic is not changing.
Okay, I’m not twisting and contorting the logic and making it different all the time.
I may be teaching things in greater detail and depth, but the logic still remains.
And it’s up to you whether you’re going to put the time in.
Keep learning with us.
Get new ICT lessons, study notes and updates as we build V2.