
Midnight ET Principles In Relationship To PreMArket Session
And at 7:00 a.m., that starts the pre-market session.
Date: 2026-07-17
URL: https://youtu.be/KHkUPAsdyfk?si=C3jLeDzwkD_N2tdL
If you’ve been a student of mine for any length of time, you know that I teach several specific openings.
And one of them is midnight Eastern Time.
So, in other words, New York midnight local time, and that’s denoted here, as you can see there.
And at 7:00 a.m., that starts the pre-market session.
It can technically start around 6:30.
Usually, if I’m awake, I’ll spend the next 30 minutes between 6:30 and 7:00 kind of getting a read on what it could do, what it likely may or may not do.
But officially, it’s 7:00 a.m. Eastern Time up until about 9:00.
And obviously, you know that we were looking at that relative equal low on the daily chart.
I’ll take you out to the daily chart and show you again what that is before I close the video.
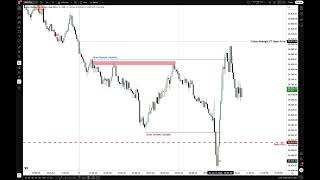
But I want to look at this here, where we have Friday’s midnight open, and we have an unrealized objective, or draw on liquidity, down here.
So we were all watching this based on my analysis and my commentary.
It’s likely to get down here and do that, like I was outlining over the last few days, explaining why I felt and gave you all guidance that we would see lower prices on Nasdaq.
And here we have it.
It happened again.
And the midnight opening price generally can act as kind of a fulcrum point, like a bookend or a beginning point of the daily range expansion.
So, in other words, if we were bearish, the normal ICT Power of Three concept would be: open, go above the midnight open, then drop lower and go lower for the day, and then close somewhere off the low or whatever.
But here we have this open at midnight, and then as we enter into Frankfurt and then London and whatnot, we had these relative equal highs here.
So we did drop down to around 4:40 a.m., but we’re getting close.
We only had 20 minutes left of the London Open Kill Zone.
And then it pulls right back up into that inefficiency that’s seen right here when we go into a 1-minute chart.
But I use the 5-minute chart simply because it allows me to show the whole panoramic view, and then we’ll break it down on a 1-minute chart.
But just be aware that this high and this high are significantly lower than the opening price, while yet not having traded to our daily objective, which is those relative equal lows on Nasdaq’s daily chart.
So we retrace back up in here, and then when we hit this inefficiency, the fact that we are entering 7:00 a.m.—this is when it accelerates and then runs down through and gets those daily relative equal lows.
Then we have massive short covering.
I outlined this is where it was going to go.
And we had this huge, massive short-covering rally that takes us back above and cleans up these relative equal highs.
Lots of liquidity in here.
So notice what it does.
It goes up and comes real close to the midnight opening price, but then falls short.
Okay, so what am I teaching here?
Whenever we go into London and we have relative equal lows like this, and then right before 7:00 a.m. we get this one more time, don’t hold with the expectation that we’re going to go all the way back up to the opening price.
That’s not necessary.
It can, but many times it’s not going to do that.
But once it does that, look for your target at the relative equal highs.
And then in here, you can take some profit.
Now notice that the fair value gap that forms here—beautifully done—trades up, fails to get the bodies to consequent encroachment, and sells off.
We have an order block here on the 5-minute chart.
The change in the state of delivery is right there.
Once it passes through it right on that candle, it need not, like it does here, close below it.
We don’t need to see that, okay?
It does not need to have that.
Your narrative has to be correct.
And then the market rallies one more time up into it there and here, and it finally gives up the ghost.
And we’re back inside this area.
I would be content and be done with today’s trading, but we’ll see what happens at the close.
We have a minor sell-side liquidity pool here, which is just above our daily relative equal low draw of 28,512.
And we had a nice sell-off that aggressively runs into it.
And then once we have that, we come all the way back up into these relative equal highs.
So I want you to think about what you saw this week.
Okay, I gave you very specific things that we would be looking for each day, very specific weekly draws on liquidity, New Week Opening Gap.
And I was particularly focusing on the Nasdaq only.
I wasn’t really giving anything in terms of ES or the Dow or any other markets because I wanted you to focus on one market with me all week.
Now obviously, you can argue and say, “Well, you only talk about Nasdaq.”
That’s not true, okay?
But I wanted to dilute your attention and focus on just one specific market so that way you can hold the flame to my feet and say, “Okay, let’s see what this old man can do.”
Is he accurate?
Is he able to see this stuff?
Are these tools really speaking?
And can you find clarity with their use?
And I would humbly submit that, you know, look at what I gave you this week.
Every single day, every single day, exactly what the market was likely going to do.
Loading post from X…
A preserved copy is ready if the original cannot load.
Loading post from X…
A preserved copy is ready if the original cannot load.
Keep learning with us.
Get new ICT lessons, study notes and updates as we build V2.