
Chain Of Custody Of Price With Daily Inefficiencies
Just a quick review in case you weren’t able to listen to the Trader Roundup Twitter Space—or X Space—on Sunday.
Date: 2026-07-28
URL: https://youtu.be/XKjdVwBUs2E?si=1Yh8OybVT5npa4IO
Loading post from X…
A preserved copy is ready if the original cannot load.
Just a quick review in case you weren’t able to listen to the Trader Roundup Twitter Space—or X Space—on Sunday.
I basically covered the move that took place on Monday, and a student was asking me about this sell-side imbalance, buy-side inefficiency.
I guess the conversation with the student got me talking about it again.
I had no intention of sharing any forward analysis, as I indicated last week.
This week, I wanted you all to rely on yourselves.
I basically told the student—and everyone listening—that price would likely draw up into this volume imbalance and then sell off.
We were looking for this buy-side imbalance, sell-side inefficiency here, and price traded down into it on Friday, reaching consequent encroachment.
Then today, price opened and traded up into that volume imbalance right there.
You count these levels here as gradient levels for price to draw down into.
What timeframe is it anchored to?
The daily chart.
So the daily chart gives us these octant and quadrant levels.
Price traded directly up into this volume imbalance, which also aligns with Friday’s New Day Opening Gap.
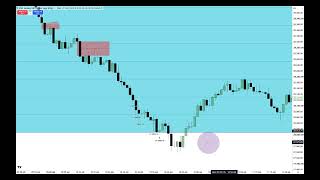
When we move down to the lower timeframe, we can see price drive up into this area and then sell off.
So when we map the daily chart onto the 1-minute chart, these lines represent the daily octant and quadrant levels.
You can see how price is working inside Friday’s New Day Opening Gap.
This is also the lower volume imbalance on the daily chart.
I recorded a short snippet from the Trader Roundup in Kit’s X Space, which he hosts and helps manage by directing the flow of questions and whatnot.
I clipped a small portion of it and posted it on my X account so you could hear exactly what was said.
Loading post from X…
A preserved copy is ready if the original cannot load.
I gave you exactly what was happening on Monday.
So here’s that upper volume imbalance from May 5th—May 5th, 2026—on the daily chart.
Let me go back to it quickly.
Now we can drop back down to the 1-minute chart and see how price is using these levels.
It’s pretty random, isn’t it?
All right, so we’re going to go back in.
You can see that overnight, price traded into Friday’s New Day Opening Gap, which aligns with that lower-level sell-side imbalance, buy-side inefficiency—the volume imbalance.
If you measure the Fib from the high of the May 5th, 2026 candle—which is what this upper level represents—down to the low on the daily chart, and project those levels forward, you get these reference points here.
You have the high, the upper octant, the upper quadrant, consequent encroachment, the lower quadrant, the lower octant, and then the low of the May 5th, 2026 buy-side imbalance, sell-side inefficiency.
You can see how price left this area up here.
We have the octant there, and this could have been an area where you anticipated price trading up into.
Had it done that, it would have been an area to get short.
Look at what price is doing.
It’s keeping the bodies outside the upper half of that range.
Look at all the bodies—they’re staying outside of it.
That’s an indication price is likely to move significantly lower.
Then we break aggressively to the downside.
We have another octant just below consequent encroachment of the May 5th buy-side imbalance, sell-side inefficiency, with nothing inside this area that we can use.
When price starts spending a lot of time between octants and quadrants, it’s usually an indication that you should sit on the sidelines and do nothing.
Okay?
Don’t try to do anything fancy.
Don’t keep squeezing, trying to get more blood out of the turnip.
We have relative equal highs between here and here, so there’s buy-side liquidity resting right there.
So, not a bad little technique, is it?
You’re looking at specific inefficiencies and grading them.
It just so happens to be the same inefficiencies I’m always talking about, which is probably random.
But I wanted to preface this by saying that you can see these things being explained beforehand.
You can see them being demonstrated.
I show executions.
You also see me getting stopped out sometimes.
The volatility right now is extremely high, and there’s nothing I can do about that except consider getting back in, moving to the sidelines, or reversing and going in the opposite direction.
So if you’re having difficulty finding your footing, stability, or consistency right now—especially if you’re brand new—don’t let that beat you up.
There are times when the market is simply going to be more difficult than it is at other times.
Forcing your will on it or complaining as though that will somehow change it does nothing.
The only thing it does is give you a toxic mentality.
Keep learning with us.
Get new ICT lessons, study notes and updates as we build V2.