
Chain Of Custody Of Price With RTH ORG
I received a couple of questions in the comments and replies on my X feed about the topic I’ve been focusing on: the chain of custody of price.
Date: 2026-07-28
URL: https://youtu.be/V5crdCw0AsY?si=O6QEC4FSGeSa08Fk
Loading post from X…
A preserved copy is ready if the original cannot load.
I received a couple of questions in the comments and replies on my X feed about the topic I’ve been focusing on: the chain of custody of price.
How does price move from one key PD Array to another?
What makes a PD Array key or high probability?
How does price navigate from one specific level to the next without relying on archaic retail mythology like support and resistance, supply and demand, and all the other gimmicks out there?
We’re going to strip it down to something highly visual and mathematical.
That’s why these markets are algorithmic.
It removes all the tinkering and the constant need to babysit price delivery.
It’s autonomous.
When it suits their purpose, they may disrupt it for a short period of time, and then everything returns to autonomous delivery.
You’re welcome to have your religion about buying and selling pressure or whatever else you believe makes the market move up and down.
But for those asking what I mean by the chain of custody of price, we’re going to look at that now.
On the daily chart, we were discussing this buy-side imbalance, sell-side inefficiency as a suspension block.
The blue-shaded area has now been graded.
It has the octants, the quadrants, the high, and the low.
You already watched the video showing where the key PD Arrays overlap with these levels.
Whenever you’re trading inside a daily or weekly inefficiency, it’s extremely important to consider these measurements.
That’s why I teach you to grade them.
Every inefficiency needs to be graded.
Then, when time and price agree at these levels, you look for any fair value gap, order block, breaker, volume imbalance, wick, consequent encroachment, or any other ICT PD Array forming around them.
When those elements agree with time, your bias, and your draw on liquidity—where you believe the market is likely to go—that’s what makes them significant.
I told you back here where we were going.
We were going lower, and now we’re down here.
So I’m going to remove these levels and answer the question from those asking what takes precedence and what is more important.
They seem to be getting confused because I’m showing this now, while I’ve also illustrated how you can use the opening range—or the Regular Trading Hours Opening Range Gap.
So that’s what we’re going to look at now.
We’re going to drop down to the 1-minute chart.
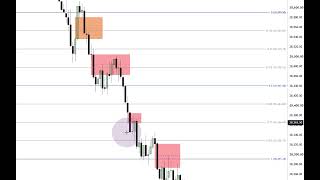
Here is Monday’s Regular Trading Hours Opening Range Gap.
All right, so what we’re going to do is take the Fib.
Use the open of the 9:30 candlestick and the final print at 16:14 shown on your Regular Trading Hours chart.
Once you have those, they’re the only two reference points you really need when analyzing Regular Trading Hours.
The idea is to take this gap and grade it.
We’re going to drop down and go to Monday at 4:15.
Yes, there we go.
All right, so while price was trading up here, the Regular Trading Hours Opening Range Gap at 9:30 begins with this opening price right there.
The highest point of Monday’s Regular Trading Hours Opening Range Gap is this level here—the 9:30 opening price.
The lowest point is this price down here, which is Friday’s final print at 4:14 p.m. Eastern Time.
This blue box here extends all the way down to that low.
Now, price could trade there, but what if you didn’t notice it?
What if you didn’t use it in your analysis and relied only on the concept I teach with the Regular Trading Hours Opening Range Gap—grading it, then looking for key PD Arrays to form around the octant and quadrant levels?
What are you left with?
We’re going to remove the blue box for now, just to eliminate any confusion.
Here we have a buy-side imbalance, sell-side inefficiency that forms at 9:35.
We also have a SIBI that forms at 9:32.
So that is the first presented fair value gap.
What is its first utilization?
Sell-side delivery.
So if we’re bearish—and we’ve been bearish—we wait for price to trade back down through it.
It does.
It closes below, and then we use it right there.
So there’s your short, using the octant right here.
Candlestick number two—the candle that creates the inefficiency—needs to align with an octant or gradient level within the range defined by your analysis and draw on liquidity.
So if full gap closure down here is your draw on liquidity, that is your objective.
If you’re simply using the Regular Trading Hours Opening Range Gap, you don’t even need to reference the daily buy-side imbalance, sell-side inefficiency—or suspension block—that I’ve been discussing for the past week or so.
Now, with an inversion fair value gap, I teach you to reverse—or invert—the logic used for its first utilization.
Its first utilization was buy-side delivery, so it was formed by an up-close candle.
When we’re bearish, if price trades down through it here, it can become an inversion fair value gap.
And wouldn’t you know it, price trades right up to the upper octant and then falls out of bed.
We have another sell-side imbalance, buy-side inefficiency.
This is what you’re looking for in a high-probability fair value gap.
“Which gaps do you use, Michael?”
“Which ones work?”
“These never work when I try them.”
That’s because you don’t know what you’re doing.
Here, candlestick number two—the candle that creates the inefficiency—actually touches two gradient levels inside the Regular Trading Hours Opening Range Gap.
So what do you think is going to happen to price?
Is it going to make a small move, or are we going to see significant protraction lower if we’re bearish?
We’re going to see significant protraction lower.
That’s why I was expecting price to really fall out of bed.
But it came up one more time, stopped me out, and required further participation at lower levels.
Then we get down into this area and another gap forms.
Look at this.
It forms right at the midpoint—or consequent encroachment—of the Regular Trading Hours Opening Range Gap.
Now, what do you think happens when an inefficiency forms precisely around the midpoint of your analysis, leading into an unrealized dealing range?
It means price is likely to draw down to the low of the RTH Gap.
Then here we have candlestick number two.
Remember, we’re not using the levels I showed you in the previous video or what I shared on X yesterday.
These are simply the gradient and octant levels for Monday’s Regular Trading Hours Opening Range Gap.
Beautiful delivery here.
Price breaks lower, and we have another inefficiency forming directly on top of the low of the gap—the previous Friday’s settlement price at 4:14 p.m. Eastern Time.
The drop into this area is validated by looking for a SIBI.
Price trades right up to consequent encroachment and stops dead in its tracks.
The bodies remain below it.
When price starts doing these things, you then have to bring in what it’s doing beyond the scope of the Regular Trading Hours Opening Range Gap.
That’s when you bring in the levels from the daily buy-side imbalance, sell-side inefficiency that we mapped out in blue at the beginning of this video.
Those are the same levels I’ve been discussing for the past two weeks in my analysis, previous videos, and commentary on X.
Hopefully this was helpful.
When the levels are valid and the PD Arrays are valid, the concepts I teach you will agree with one another.
The more factors that agree on one side of the market, the less likely price is to move in the opposite direction.
That’s how you define high probability—at least according to the book of Michael.
Loading post from X…
A preserved copy is ready if the original cannot load.
Loading post from X…
A preserved copy is ready if the original cannot load.
Loading post from X…
A preserved copy is ready if the original cannot load.
Loading post from X…
A preserved copy is ready if the original cannot load.
Loading post from X…
A preserved copy is ready if the original cannot load.
Loading post from X…
A preserved copy is ready if the original cannot load.
Loading post from X…
A preserved copy is ready if the original cannot load.
Keep learning with us.
Get new ICT lessons, study notes and updates as we build V2.