
Predicting Session Low & High With Executions
Good morning, folks. How are you?
Date: 2026-07-29
Loading post from X…
A preserved copy is ready if the original cannot load.
Good morning, folks. How are you?
I'm going to keep this one fairly short. We'll get into the longer discussion later this afternoon.
On the daily chart, we've been talking about lower prices since back here, and price has now traded down into our objectives.
In the previous reviews, you saw me annotate this area.
There's a down-close candle here with a gap to its left.
That gap has already been used to form a Bullish Order Block, and it's sitting at a deep discount relative to where price was up here.
The opening price is changing the state of delivery on the daily chart.
Price isn’t necessarily going to touch that level and stop exactly—it can dig slightly below it, which is what we saw here.
Once price traded below consequent encroachment of this inefficiency, it was moving deeper into a bullish discount PD Array.
This is also a Suspension Block because it has a volume imbalance at both the upper and lower ends.
The midpoint of that range is Consequent Encroachment.
You’re going to get some kind of bounce, pop, or reaction here because we’re working from a daily chart.
Even if price ultimately continues lower, this area can still offer a worthwhile reaction to hunt.
So keep an eye on the 27,665.5 area or lower.
If price reaches that vicinity—especially when time of day aligns—it can produce a strong reaction.
And remember, we were talking about this before the week even started:
Price was expected to trade up first, then come back down.
Everybody else is playing catch-up.
We’re going down to the 1-minute chart now. We’ll get into the rest later this afternoon. Daddy’s still cooking.
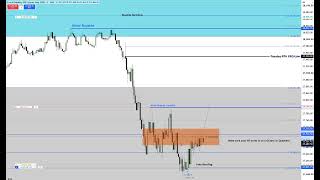
Price trades down into that lower buy-side imbalance, sell-side inefficiency—the Suspension Block we just covered on the daily chart.
This shaded gray area represents the full range, and this line is the midpoint, or consequent encroachment.
Right from the 9:30 open, price makes a small move higher, preserving these relative equal highs.
So when price drops like this, what is it forming?
As I teach price action, this is a Market Maker Buy Model.
Right here, price is trading down into an octant within the daily bullish Suspension Block.
We have:
- Consequent Encroachment of the daily Suspension Block
- The octant
- The lower quadrant
- The lower octant
- And finally, the low of the daily Suspension Block
So price is operating in a deep discount.
I love when they do this.
They probe once, twice, three times—continuing to push lower and encouraging traders to chase the move down.
We left this minor buy-side liquidity pool here.
So two things are setting up.
First, price is accumulating the engineered sell-side liquidity below.
Then it prints this wick—which is exactly what I want to see because I’m looking for an entry around that area.
When price starts forming what retail traders might call a continuation pattern, like a bear flag, that actually increases my confidence in the move higher.
Price trades softer, then we get the Smart Money Reversal, followed by the Low-Risk Buy.
From there:
First-stage accumulation → second-stage reaccumulation → expansion higher.
Price then runs all the way into this target, which was my terminus for the Regular Trading Hours session.
The market is going to draw from this discount area back up into older areas where price previously sold off—premium PD Arrays.
Here, we have one bearish fair value gap and another bearish fair value gap.
Price draws back into those premium arrays, then forms the Smart Money Reversal.
I was trying to time the entry as price dipped below the midpoint of that wick.
Let me move this up so it stops getting in the way.
Right there—that midpoint.
Anything at or below that level is an ideal entry.
A perfect entry.
I posted the sped-up version because I was short on time and had to get out of the house.
But I know what happens every time I do that—people start saying I'm speeding it up to hide something.
So when I got home last night, I uploaded the full, unedited, real-time recording. No time compression. No skipped sections. It's exactly how it unfolded.
It's about an hour long, and I know most of you won't watch it. And that's precisely why most people never learn how to do this properly.
You’re not going to learn this from five-minute tutorials.
You’re not going to learn it by watching me take a perfectly delivered market move and compressing the entire thing just to accommodate a short attention span.
At some point, you have to expand your capacity to sit with the material.
You have to allow more information in, study the full process, and give yourself enough time to actually understand what’s happening.
Down here, we get the Smart Money Reversal, with price drawing back toward the original consolidation.
Then, just above that consolidation, we have this level.
That was my objective.
That’s what I was aiming for.
Look at the entry right there. See that? It’s below the midpoint of the wick.
Probably just random, right? And there’s my aggressive entry.
I wanted to get in there and make sure I had some additional exposure, so I built the position up to three contracts.
You can see the entry prices right there.
The market then rallied, and I drew this out in advance.
Price traded above the level, came back down into it, and this wick pierced through.
I had already added the annotation because I knew the video wouldn’t have any audio.
When price came into this inversion fair value gap, the note was already on the chart:
“Now watch how it delivers.”
Then it printed this little wick right here.
You know what that is?
A mohawk.
Look at the bodies.
They can’t even close down into or outside of the inversion fair value gap.
That’s bullish.
That’s why I moved the annotation down there—to keep you focused on the same idea: watch for price to continue higher.
You can also see where my objectives were.
One of them was the prior day’s 9:30 Regular Trading Hours opening price.
I wanted to take one contract off here to show you how to graduate into understanding Market Maker Buy Models and Sell Models.
There were smooth edges in this area, which gave us the liquidity profile we wanted to see.
Now I want you to understand something, children.
This is me buying near the low while already anticipating where the high is likely to form.
You’ve seen me do this on weekly charts, weekly ranges, second charts, daily charts, and session highs and lows.
There’s something a little different happening over here, but I’m going to save that for later.
Otherwise, this is going to turn into a very long discussion, and I want to get ready for a long nap.
If I can finish what I need to do this morning and get some rest, I’ll come back and show you the fun stuff developing on the hard right edge of the chart—the part you can’t see yet.
Hint, hint.
Full Trade Entry To Premature Close Due To Family Emergency [Silent]
https://youtu.be/gXyoGuaOUgs?si=XVEUBShzwaGpzVp5
Loading post from X…
A preserved copy is ready if the original cannot load.
Loading post from X…
A preserved copy is ready if the original cannot load.
Loading post from X…
A preserved copy is ready if the original cannot load.
Keep learning with us.
Get new ICT lessons, study notes and updates as we build V2.