
Emini S&P 500 Review - March 27, 2023
He’s explaining the importance of the F.P.FVG without naming it as such here. 👉 If you’re just casually watching and trying to see where these levels are derived from, but you’re not actually putting
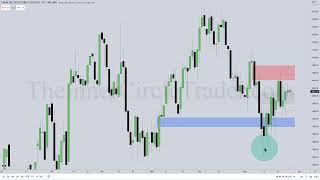
URL: https://youtu.be/NkwqJBzgQwo?si=hRLsPhey0zKZNoiz Watched Date: March 27, 2023
He’s explaining the importance of the F.P.FVG without naming it as such here.
👉
If you’re just casually watching and trying to see where these levels are derived from, but you’re not actually putting them on your own charts, I promise you you’re wasting your time.
You have to do the work yourself: take the information, mark it on your charts, and then continuously cycle through in a top-down manner — from the daily chart, to the hourly, to the 15-minute, to the 5-minute, and finally down to the 1-minute.
Macros
👉
My version of back-testing is all of this annotation work — it’s not pushing a button on some market replay tool. That kind of replay is a forward walk test you do before going live, using real-time and demo; there’s a step between that and what we’re talking about here.
This is back-testing my way: studying price action, walking through all the scenarios, and mapping out the idea. All this empty space here, here, and over here on the chart is where you would be filling it in on your own charts — explaining, for example, how price returned back to the consequent encroachment of that discount level, which is now acting as an inversion level of resistance.
When the market opens above the previous session’s close (the settlement price), the distance between that close and the 9:30 open is your opening range gap. In this example, we gap higher, so the opening range gap low is the previous day’s settlement/close, and the gap extends up to the 9:30 open. Price will often trade back down into that gap; it may return all the way to the opening range gap low, or even go beyond it if there’s additional discount and sell side liquidity to reach for.
On a very important note: around the 13-minute mark he introduces a PM session projection using advanced institutional market structure.
He shows that a low – lower low – higher low formation creates an intermediate-term low that can be trusted as a low that is unlikely to be breached if you’re expecting higher prices. The higher low in that structure is then used to project Fibonacci targets that line up with other influences such as the F.P.FVG and the m15 breaker.
He emphasizes the F.P.FVG in a very subtle way that only the careful students will notice and study — real mastery.
Right at midnight New York local time, mark the price on your chart. That level is crucial: the best short positions will form above it, and the best long positions will form below it. This simple rule will serve you extremely well going forward.
Keep learning with us.
Get new ICT lessons, study notes and updates as we build V2.