
Live Tape Reading PM Session - March 23, 2023
02:27 - Good afternoon, everyone. 04:34 - How do I make my lines look like this? 09:42 - Today is the immediate day after FOMC event.
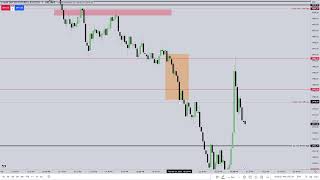
URL: https://www.youtube.com/live/-o4zXIhggFs?si=wWiVd2vbXhVAmDOs Watched Date: March 23, 2023
Outline
02:27 - Good afternoon, everyone.
04:34 - How do I make my lines look like this?
09:42 - Today is the immediate day after FOMC event.
15:06 - How to use this chart to get a better understanding of the current market.
21:44 - How to trade in the London session -.
25:52 - Short-term oversold without an indicator.
31:05 - Why would you want to do that when there’s days where you can go in and out in 20 minutes?
37:06 - The market is going to do what it’s going to do and you can’t hide it.
39:49 - What is more likely for the bottom end of that shaded area to be traded to go down or up?
46:13 - New Weak Opening Gap -.
53:12 - How do you know when you’re in a gap?
59:57 - If you were really trying to do this and you were honest with yourself, you would want to know everything that I'm willing to give you.
01:05:35 - What you’re lacking right now -.
01:11:27 - What’s happening in the Dollar Index.
01:17:11 - What are the inefficiencies in the market?
At the open, price rallied directly into the 2.55 pm m5 SIBI gap that had been identified in advance. As the gap extended, it behaved as resistance and capped the advance, just as anticipated. Price then rotated lower and delivered into the nearby imbalance, lunchtime sell-side liquidity.
On the 15-minute DXY chart, this morning’s relatively equal highs are in place; price may seek a run into that buy-side liquidity.
m5
m4
m3
m2
m1
he returned to m3 chart because it has easy to see SIBI on m3 chart
daily SIBI
YM (DOW) low timeframe view
After FOMC, the range is usually huge—and precision thins out. That doesn’t mean setups disappear; it means the market is less willing to sprint in your favor. Expect deeper-than-ideal retracements, longer consolidations, and stretches of chop that test your patience—especially if you’re used to clean, quick runs.
Your focus remains the same: hunt for low-resistance liquidity runs and build your study and execution around those conditions. On days like this, accept the reduced precision, filter harder, and let the market prove it before you engage.
It’s later in the 2 p.m. hour and we’ve been dripping lower, so a short-term rally back into this area is reasonable. We’ve broken several lows without true downside follow-through—short-term oversold, no indicator needed. If price pushes up, note the nearby imbalance and the high of the Opening Range Gap (ORG). A brief wick above that ORG high is acceptable; then watch behavior.
Because stops have trailed down, a small pocket of buy-side liquidity sits above the short-term equal highs. If price reaches that pocket and rejects quickly, the next pass through the most recent low should accelerate, drawing into the liquidity resting beneath. That’s where sell stops convert into market sell orders—fuel for short covering at lower prices.
I want rejection at that area—not a continued climb. If we get that a run higher until 2:30–2:40, I’d anticipate more than a simple tag of the opening-range low in the last hour. A revisit of this week’s New Week Opening Gap (NWOG) is on the table.
The sequence I’m watching for: a brief spike to clear the clustered buy-stops above (smart money sells into those stops), then distribution lower—buying back into liquidity below the recent lows and, ultimately, toward the this week’s NWOG high. That’s the path I favor into the close.
If you don’t yet know your model, submit to the work. Sit with the charts. Study old moves. That’s your backtesting.
When you review the chart, annotate it. If price takes out a prior high and prints a new high, ask: would selling into that new high qualify as a Smart Money entry? If yes, then define the ideal exit: below an old low where sell-side liquidity resides, or into a discount inefficiency.
Trading back up into the high end of that opening range could be your entire model.
Around 2:00, price traded up into the high end of the opening range gap high, then broke lower, popped back up, and displaced to the downside. That sequence alone is five handles—you could literally replace your job with just that single move. That’s all it requires. But you see me post 100-handle moves, 30-handle moves, 20-handle moves—example after example—and you think that’s what you should be doing because the hypothetical paper-trade P&L looks enticing. My aim, though, is to teach the skill set so you can confidently capture the smallest, simplest objective consistently every day. Even on tough days like this, these setups keep forming. When someone can walk you through it before it happens—laying out the logic—you get to see it and experience it. That’s mentorship, and it’s calming: no emotion, no need for the trade to be profitable, no fear of being wrong. You’re studying. You’re learning to submit to the process, because the market is going to do what it’s going to do.
Understanding where turns can form—and how far price might extend higher—tells you what it signals and helps you anticipate where the market will gravitate next: the draw on liquidity. That is the number one skill to learn first and refine continuously as you develop your model. Knowing where price is likely to go is your primary goal; everything else will get you in trouble if you don’t have direction. Order blocks, fair value gaps—none of it matters without direction. And direction doesn’t mean a rigid bias; it means identifying the next draw on liquidity. You can trade without a bias.
🔥
They asked: Is it important to have an intraday bias to trade, or can you trade purely off internal intraday liquidity? Once you understand what you’re looking for—the time-of-day behavior and when certain macros kick in—you can trade by reading the draw on liquidity. A “macro” here means knowing where the market is likely to draw to next, which pool of liquidity, and when. You must know the target liquidity and who’s been making money right now. Macros typically rotate against whoever is currently in the money; that’s their function. Recent price movement—whether on the 1-minute, 5-minute, or 15-minute chart—tends to flip at specific times.
Be mindful of the daily and weekly ranges and how intermarket relationships align at specific times of day. Once you grasp those elements and layer in the macros—what they are, why they form, and their purpose—everything clicks. You’ll begin to anticipate what’s most likely to occur in each interval. In a defined 20-minute window, you can expect a setup reliable enough to set your watch by it. You can even sleep in, ignore the noise, show up for that window, trade what you see, take your five- to ten-handle move, shut the charts, and get on with your day.
If you look at the range from the ORG High to the current price, the midpoint sits roughly here. Measuring from this high down to the New Week Opening Gap (NWOG) High gives about the same halfway point—essentially a measuring gap. My target is the level I outlined earlier (current NWOG High), and because there’s a fair value gap here, I want it to stay open; it aligns with that midpoint toward the next objective. As noted when price was higher, if we trade through the bottom of this Daily SIBI, we should gravitate down to the NWOG High given how this range is developing.
If you were trading this, you’d either short—with leverage—at the Opening Range Gap (ORG) high, accepting the risk of a run above the nearby highs (which can be unsettling); or you’d wait. If price spiked above those highs and then broke down, you’d wait for a standard SIBI, take the short within it, ride the move to the ORG low, and, if momentum continues, into the New Week Opening Gap (NWOG) high.
🔥
The purpose of these live streams is to desensitize you to price fluctuations.
I want you to understand why you must commit to a defined idea I’ve taught. If you don’t, you won’t know what to reach for when price doesn’t move in your favor. During consolidation, many of you see a quick drop, spot a pin bar, and assume a reversal will fill the nearby gap. I called it a measuring gap. A measuring gap is identified by the inception of the move, the terminus, and the midpoint between them—right where the gap sits. Measuring gaps, like breakaway gaps, are not expected to fill. And if one does fill, it doesn’t change my treatment of the setup. The point is to know where a move begins, where it intends to draw next, and to classify the gap accordingly. You determine the draw on liquidity first; then the tools—gaps, FVGs, order blocks—are applied in alignment with that directional premise.
You place a trade thinking you know what you’re doing—and suddenly you can’t breathe. Price isn’t moving for you, you’re not stopped out, but your mind starts racing: Will I get stopped? Is it about to turn? What’s normal here? You don’t know because you haven’t done the work I’m walking you through. That’s exactly why some students who even paid me still failed: not because the concepts don’t work, but because they were lazy. Don’t be a lazy student. Do the drills, log the experiences, and define “normal” through repetition.
“Plan your trade, trade your plan” doesn’t always work—especially when you don’t know what you expect from price. You can’t yet tell whether a sequence of candles is a true reversal or just a consolidation or a retracement before the next leg down—or up, if you’re bullish. You don’t have that clarity yet.
I’ve watched candles print for three decades. I’ve had good days and bad, strong months and lean ones, winning years and losing years. Over time I learned to read the tape—to hear the story price tells—down to one-second intervals and the one-minute chart.
When you watch price action long enough, the patterns become familiar—“this is normal; price should do this.” A novice, trading with retail logic, sees one candle and thinks the move is over or a vicious reversal is coming. You won’t.
When we’re bearish, up-close candles are a good thing. If price trades below them, they often get revisited as a bearish order block and should repel price lower. We’re not afraid of green candles in a down move, even big ones.
Don’t jam your stop. Don’t fuss over it—it’s paid to do its job. Your job is to watch price: is it giving immediate feedback that you’re onside, and is it behaving in ways consistent with the order-flow logic I teach?
Everything I’m reading in these candles comes from price itself. It’s likely to gravitate toward the levels I’ve marked, especially at the times of day when liquidity typically draws. The market is rolling over those who made money this morning—longs. This move exists to strip away their chance at profit.
While you’re trading, you have to manage the trade—and you have to manage yourself. How? I’ve been here before, and I keep an internal dialogue I’m sharing with you so you can adopt the same calm—not completely stress-free, but more comfortable because you’ve seen it before. You’ll hear my voice in your head; I’m the “ghost in the machine.” Your brain is the machine—the mechanism between your ears that decides when to get in and when to get out. Once you’re in, what most of you lack, because you’re new, is experience.
When real risk is on—when you could blow the account or sit through drawdown—what do you lean on when you can’t breathe, when anxiety grips you, when you want to close simply because you can’t hold anymore? Sometimes you’ll even be in profit and it’s harder to think because it’s taking off; you didn’t have a limit order, and now you’re asking, “What do I do?” You learn this by watching these live streams and spending time with me—because then we’re not surprised.
Look at this—can you believe it? We’re down here in this move and it tagged right here. Who would have known? How could anyone have guessed it would play out like this? To me, it’s old hat—and it will be old hat for you. You’ll have the same memories surface because you’ve spent time with me. You’ll hear the things I’ve said during these live sessions echoing in your head, anchored in your understanding. Your memories will be rooted in these efforts—not from a book, not from a static, hindsight video, but from watching it live on real-time data. That’s experience, and you can’t fake it.
Here’s what I want you to do: submit yourself to these ideas. Keep the “algorithm” talk out of your mouth—don’t worry about it. If it’s a sticking point, don’t refer to it at all. It is what it is. If it trips you up, just stop talking about it.
We took out three lows on ES—three successive lower lows. The last one stopped just short of the New Week Opening Gap (NWOG) low. At the same time, the Dollar Index ran into three premium arrays, tagging the 15-minute high.
Note the reaction: with three liquidity pools tapped and a low forming at a logical level—consequent encroachment (CE)—the candle bodies respected CE, then we saw another sweep of the low. With DXY trading into three premium arrays, a retracement is the likely outcome. Timing favors the move into the three o’clock hour, with a reach back up into the Opening Range Gap (ORG) area.
🔥
Time elements include how often price returns to a liquidity area.
That’s a genuine liquidity void.
m15 SIBI
What is that? Price trades up into consequent encroachment of the wick and tags it. We then get a complete repricing back up through the prior down-close candle, filling what was inefficient on the buy side. Because that candle was a large down-close, it did not deliver buy-side efficiently. To deliver buy-side efficiently, price has to reprice upward—from the low back through the high—offering movement to the upside. That is repricing over prior sell-side delivery, but it was originally inefficient on the buy-side. Think of the paint-roller analogy: when you first roll, the paint is thick, but as you keep rolling you leave thin spots—little pockets the paint didn’t cover. You have to roll back over them. The same thing happens here: the down move leaves small pockets of inefficiency that aren’t obvious at first, and price later rolls back over them to fill in.
In this move, what do you see in terms of inefficiency? The shaded area is a large down-close candle, creating a 15-minute fair value gap (SIBI—sell-side imbalance, buy-side inefficiency). What’s missing is efficient buy-side delivery. Within that shaded area, look closely: where are the remaining inefficiencies?
It has to push slightly past that level to achieve efficient delivery, because of the bid–ask spread. To print that price, it must move one tick further.
Within these inefficiencies, drill down to smaller timeframes. If you can use the 30, 15, 10, 5 seconds charts, you’ll see them more clearly—like putting a slide under a microscope and zooming in. You’re zooming in to target the actual inefficiencies and to judge how far price can retrace into them. Ask what’s happening at 3:00 p.m. that drives this behavior: the bond market is closing. That close can ripple into equities—sometimes producing continuation, sometimes a reversal, and sometimes a retracement before continuation. You must know what you’re looking for, where you are in the higher-timeframe context, and what liquidity is still left to be taken or which inefficiencies remain to be traded back into.
Keep learning with us.
Get new ICT lessons, study notes and updates as we build V2.