
Live Tape Reading - March 15, 2023
01:36 - Audio check. 02:59 - Daily chart of the day. 07:46 - What we’re seeing in the morning session.
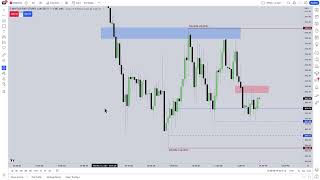
URL: https://www.youtube.com/live/ZpSwaiwGgt0?si=GovBDLjMMm1O5NnY Watched Date: March 15, 2023
Outline
01:36 - Audio check.
02:59 - Daily chart of the day.
07:46 - What we’re seeing in the morning session.
10:42 - Why you need to anticipate trading the afternoon session -.
17:24 - What’s gone on so far this week.
25:08 - What is the fair value gap?
29:55 - Dollar index is not lending any clues of weakness yet.
34:08 - Price swings within price swings within price swings.
38:01 - How could you use this as a model if you wanted to trade this and be short?
45:24 - How do I add the nasdaq chart at the bottom of my trading chart?
52:16 - What is choppiness? -.
55:40 - Retail traders are doing what 90% of retail traders are doing -.
01:01:53 - The difference between what I’m teaching you and what you learn anywhere else.
01:10:04 - When does the next big move usually occur?
01:13:10 - When do we engage when do we engage? When do we anticipate certain things?
01:19:31 - Where’s the market drawing to win the weekly and daily charts? Where’s the inefficiency?
01:22:45 - Is there any fair value gap below market price? Does that range offer opportunity for you to get at least five handles?
01:29:15 - How to trade with real money -.
01:36:15 - It’s not the buying and selling pressure, it’s the immediate feedback.
01:39:32 - What are you aiming for in this expansion?
01:46:05 - If you don’t do all these things, you will fail.
01:49:23 - What are they failing to do? They’re failing to find something that matches their personality, they’re failing to understand what makes
01:54:54 - Michael’s story of how he got into trading.
02:01:02 - Why he’s a book smart guy -.
02:04:02 - When you need help with something, they’re there to scratch your back.
02:09:35 - Why you should not learn how to trade with a live account -.
02:15:44 - What’s in vogue now is failure.
02:20:06 - The first step to entering the market is to know where it's going.
02:26:44 - You need to give yourself a cheerleading session before you open up the opportunity for trolls.
02:29:55 - When you’re in line, it’s the mental side of things that are not really trading.
02:36:23 - Why you have to know exactly what you’re looking for.
02:43:55 - Don’t be your own cheerleader.
02:48:27 - Identifying where you’re at in your career -.
02:53:37 - What’s going to happen if the index goes above $1,000?
02:57:21 - How to interpret forecast consolidation days and consolidation sessions.
03:02:49 - How do you know you’re ready to trade with real money?
03:09:07 - The downside open on this candle traded up, traded down.
03:11:11 - Is this a day you would have felt good about participating in or would you have regretted it?
03:15:35 - What is a day that you’d rather be doing something else?
Current Daily dealing range marked in pink lines Previous day discount wick c.e. marked in red line
If we drop lower than the low marked in pink, the lows on the left side become suspect lows (we expect them to be reached - ICT says that he doesn’t think that’s likely)
We’ve had a large expansion overnight.
On the daily chart, this defines our dealing range — the area between the most relevant high and low at the moment.
📊 Yesterday’s up-close high is important, and so is today’s low.
🎯 This is the range we are currently operating within.
We’ve already interacted with this wick today, so I’ll be watching closely to see if the algorithm wants to revisit that area again.
🧭 Key levels:
- Consequent Encroachment of the wick: 3867.25
- Current session low: 3865.00
There’s a lot of noise in the media right now — talk about banks failing and fear spreading through the system.
📰 The narrative is clearly designed to make people anxious, to stir emotion and uncertainty.
🧠 But as traders, we don’t concern ourselves with that. The algorithm doesn’t react to fear — it executes code.
⚖️ Worrying about headlines doesn’t improve performance or outcomes. The market will do what it’s programmed to do, regardless of emotion.
One of the things I’m observing is the notable smoothness in this area. With the overnight drop, we’ve already taken out these lows.
I want to make it clear that I’m in no hurry today to establish a firm directional bias. Yesterday, I did a thorough job walking you through the live price action multiple times, with a fair degree of precision.
It’s forming roughly three relatively equal lows. We’ve moved below that level so far today, creating sell-side imbalance and inefficiency.
Now, we’re watching to see how much of this range the market wants to revisit.
This is where we’re opening compared to where we closed yesterday. There’s a significant discount between yesterday’s close and this morning’s opening.
The logic here is that we could revisit this level, which in my opinion would qualify as a gap closure. It doesn’t necessarily require returning all the way to yesterday’s closing price during regular trading hours.
The logic here is that we could revisit this level, which in my opinion would qualify as a gap closure. It doesn’t necessarily require returning all the way to yesterday’s closing price during regular trading hours.
We have a soft bias suggesting a potential return to 3914.50 — that’s an area of interest for me. It doesn’t mean I’m going long there.
By marking the 3914.50 level — the last candle of yesterday’s regular trading session — we can note that it closely aligns with this candle’s wick at the consequent encouragement. While price could push deeper into this range, it might extend as far as the previous day’s final hour candle.
On a day like this, with a significant overnight move, your first rule of thumb should be to slow down. It’s often wiser to anticipate trading during the afternoon session, since the morning tends to chop around, produce false moves, consolidate, and engage in a lot of seek-and-destroy behavior.
Seek & Destroy refers to when price moves above short-term highs, then below short-term lows, only to return back to the middle. Later in the day, this often leads to a large expansion move, drawing toward liquidity that hasn’t been tapped for some time. That’s why I’m not yet comfortable giving a clear bias.
Whenever there’s a large move or a wide range, you must be cautious the next morning — avoid chasing price after such an expansion. Notice the candle ranges: they start relatively small, then expand significantly as price drops lower, aggressively attacking sell-side liquidity. We haven’t been able to trade above the 3972.50 level, failing to reclaim it, and overall, this weakness has continued to roll over throughout the overnight session.
We’ve moved roughly 90 to 100 handles — a major price move — and to see that happen entirely within one session, from the London session into early New York, is significant. Be cautious: don’t chase it, but also avoid trying to pick a reversal.
My focus is on the afternoon session, specifically between 2:00 PM and 4:00 PM — that’s the key two-hour window I’m most interested in.
There’s a Fair Value Gap (FVG) that aligns perfectly with a Mitigation Block.
Think of a mitigation block like a breaker structure, which most of you are familiar with.
In a bearish context, a breaker forms as a high–low–higher high sequence, with the down-close candle inside that low acting as the key point.
However, in this case, we have a high–low–lower high that eventually breaks lower — that’s a mitigation block, essentially a failed breaker.
Despite being “failed,” it functions similarly to a breaker.
Many traders mistakenly treat these levels as simple support and resistance zones, assuming that where price turned before must be significant again. That’s incomplete thinking — there must be context behind the turn.
Here, the previous high took out liquidity, price then dropped, tried to rally again, and failed to break the prior high.
Anyone who went long in that move and held as price dropped below would now have positions underwater.
When price later returns to that level, it gives those trapped longs a chance to mitigate their losing positions — hence the term mitigation block.
Unlike order blocks, price itself isn’t mitigating; the participants are.
The pullback into this Fair Value Gap is significant — this level can serve as resistance.
We would reasonably expect price to fail to trade cleanly through it, because traders who went long earlier are now underwater. When price revisits this area, those traders are eager to exit their losing positions.
The algorithm simply allows participants to exit their long positions — it’s not the act of selling or buying that moves price, but the algorithm’s design to rebalance and manage that flow efficiently.
🔥
I want to see multiple factors aligning in my favor — clear confluences that collectively support the idea of a sustained run.
I mentioned on Twitter that this week would be more challenging than most traders are prepared for, either because they’re new or simply unaccustomed to this level of manipulation — and right now, there’s a lot of it unfolding.
If they’re smart money, how do they still end up in losing positions?
Because they’re human — they speculate, make mistakes, and have off days like anyone else.
The algorithm is the artificial intelligence behind price delivery; it’s not driven by buying or selling pressure, but by its programmed logic.
Smart money participants simply respond to what price is showing — entering, exiting, or reversing positions based on perceived opportunity.
As a developing trader, your goal should be to focus on those incremental milestones — learning to identify why price should be drawn to a level, and why it reacts the way it does once it gets there.
See this wick? Once we trade above it, I like to mark the consequent encroachment of that wick — because price can retrace down into it.
That level, around 3892.75, is important to me.
Price may probe slightly below, but ideally, I want to see the candle bodies hold above that level — maintaining structure and confirming it as support within the algorithmic framework.
The next candle trades up, almost fully closing into the previous candle’s low before moving down — that’s efficient delivery; there’s no fair value gap there.
Then we open the next candle, trade up, and leave a small gap — that’s overall our efficient delivery.
If price moves above that FVG along with the mitigation block, that becomes an inversion FVG+.
For bullish continuation, this level would need to hold as support, and price must power through the next gap decisively.
Right now, this is just the first point of interest — we’re observing, not reacting.
It’s still within the opening range, less than 30 minutes since the session began, so our goal is to read behavior, not chase moves.
Given the large overnight drop, every retail trader is looking to chase the move down — which means stop-loss orders are building just above that wick.
The market runs to those stops, aligns with the fair value gap, and reacts from the mitigation block, exactly as the algorithmic logic suggests.
If price touches this candle’s high and does so within one candle, that’s what I call an immediate rebalance.
When you have a large up or down candle, and the next candle opens and trades all the way back to the previous candle’s high or low, leaving no gap at all, that’s the algorithm restoring efficiency instantly.
It’s one of the sharpest, quickest rebalancing moves — and it rarely offers a clear entry opportunity because the market rebalances and takes off immediately.
I want to see whether price shows reluctance to reach even 50% of that range — the equilibrium.
If we trade above equilibrium, that takes us into the fair value gap, which lies in premium relative to this high and that low.
We don’t need any indicator to confirm it — the price action itself defines the range and balance point.
What I’m suggesting here, in terms of narrative, is that the fair value gap and the mitigation block we’ve outlined represent areas where Smart Money was likely long and went underwater.
Since they’re in the business of making money, when the algorithm allows price to reprice back into an inefficiency and a mitigation block, they’ll use that opportunity to close their longs.
Those neutralized long positions signal to me that, if price fails at that level, the better side is still looking for lower prices.
The move up would have served its purpose — running the buy stops resting above short-term highs and clearing out trailing stops from overnight shorts.
Retail traders, watching a one-minute chart, would interpret that as resistance, but from an algorithmic perspective, it’s simply price rebalancing inefficiency through mitigation.
At this point, we’ve already seen movement worth around five handles or more, just as anticipated when I mentioned that wick — and if price continues lower, that’s exactly where I want to see it go.
Notice on the five-minute chart, it doesn’t appear as a clear fair value gap — you’ve got three five-minute candles forming one fifteen-minute candle.
So the fair value gap we marked on the fifteen-minute chart isn’t immediately visible here, except for a small separation between candles.
That minor gap can be refined as the true fair value gap when dropping down from the higher timeframe.
This process — calibrating your PD arrays — means aligning the higher timeframe structure with the lower timeframe precision.
You can see how price moves right up into that refined level, tags it perfectly, and then drops down to the consequent encroachment of that wick — a textbook demonstration of multi-timeframe balance and precision.
Keep learning with us.
Get new ICT lessons, study notes and updates as we build V2.