
Live Tape Reading - Fed Chair Testimony - March 07, 2023
00:40 - Fed Chairman Powell to testify today. 03:30 - When the Fed is involved, all rules go out the window. 12:07 - What to watch for in the FX market.
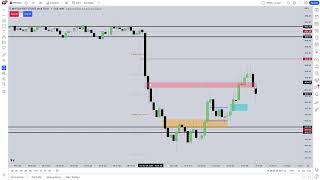
URL: https://www.youtube.com/live/wu0sQarBRrI?si=4RFAy5CtZJunqBVC Watched Date: March 7, 2023
Outline
00:40 - Fed Chairman Powell to testify today.
03:30 - When the Fed is involved, all rules go out the window.
12:07 - What to watch for in the FX market.
19:46 - Highs and lows of the day.
26:04 - Using the Dow as a barometer for the US Dollar.
30:40 - Dow Futures and Dollar Index:.
37:18 - The low midpoint of this chart.
40:52 - If you had the benefit of toggling between toggling between Dixie and DDS, why do you do that?
45:38 - Real-time real-time trade idea.
49:48 - What is an imbalance inside of a breaker?
The economic calendar for today and tomorrow shows that Fed Chairman Powell will be testifying at 10 o’clock on both days — today and Wednesday.
In my opinion, you should not be trying to speculate this morning. No one has any idea — I have no idea — of what’s high probability or low risk when the Fed is involved. When they step in, all logic and concepts, including mine, go out the window. It’s manual intervention — they’re going to do whatever they want, period.
This is not a lack of liquidity, as some claim. It’s an absolutely controlled demolition — a time when you want to sit on your hands, be content with not knowing, and give yourself permission to say, “I don’t know what they’re going to do this morning.” You should have no bias today.
What you’re doing is simply observing — watching how the market reacts to the Chairman’s testimony during the 10 o’clock hour, and what’s left in its wake. That means watching for liquidity and inefficiency, because those are the only two factors the market will focus on.
It will either:
- run higher for buy stops, or reprice to an inefficiency like a fair value gap above,
- or drop lower toward sell-side liquidity, or an inefficiency like a fair value gap below.
So this morning is about observation, not participation. The Fed Chairman isn’t literally pushing price around — the market is undergoing a series of manual interventions that will drive it toward levels that may or may not align with your expectations.
Every time I’ve traded during these periods, I’ve never felt comfortable — even when I was right. Any other day, I’m confident, not afraid, not lost in the charts, because I know what I’m looking for. But when the Fed is involved, all rules are suspended.
Once the testimony is over — a couple of minutes, maybe 15 minutes after that — the “lay of the land” becomes clear. Whatever the chart shows after that is what I’ll use to plan the PM session. Speculation during the morning session, however, is pure gambling.
If you happen to win during this time, it would be foolish to attribute that win to skill — yet some do. By speculating during this period, you’re willingly exposing yourself to risk without having any real idea what’s going to happen. You don’t know where the market will be taken, how it will be delivered, or what “profile” (schematic or roadmap) will be used.
Normally, when I outline price action for you — showing why markets hit one level first and then another — that’s narrative. But when the Fed steps in, that narrative can’t be relied upon. There’s no way of knowing the influence or the footprint in advance.
That’s why it’s so important to respect this risk and to understand that you should not expect to know what to do in the morning session during Fed events. To believe otherwise is foolish. It’s literally gambling because you don’t know what the market will do.
Any other time, I have a pretty solid inclination of where markets are going — and that’s been the case for years. But there’s no weakness in saying, “I don’t know right now.” It’s the truth — and no one else does either.
I have no shame in admitting that, as your mentor, this is a moment when I don’t know — and that’s perfectly fine. There’s no hidden secret, no special model, no method that works flawlessly during times like this. I simply step aside, let the market do what it will, and allow the chaos to play out.
The PM session runs from 1:30 to 4:00 PM New York local time. I’m not interested in pushing any buttons this morning, and neither should you. That way, we remain disciplined and aware of what we’re doing.
The foolish thing would be to think, “Since I’m not trading, I won’t pay attention.” That would be a mistake. It’s crucial that you understand how the market behaves when the Fed steps in. When it’s relevant, I’ll point out what’s important — otherwise, I’ll stay quiet.
we've taken out yesterday's high
NASDAQ has swept it's relatively close
For study purposes, when I’m looking at the market like this and not taking any trades in the morning, I use it as an exercise. During major events — such as Non-Farm Payroll, FOMC rate announcements, or a Fed Chair testimony like today — I go through a process of annotation.
What I do is imagine that I am in complete control of the marketplace. Then, I ask myself: Where would I personally steer price, and why?
To do this, I mark out buy-side liquidity pools on the 5- and 15-minute charts, noting the highs that haven’t yet been revisited. On different timeframes, the picture may vary slightly, but the logic remains the same.
I know we’re looking at the NASDAQ here, but the same method applies to the ES as well. For instance, I would annotate this high here, and these levels remain relatively similar across both instruments.
It’s not about being right or wrong, or even about finding a trade setup. I do this purely as a personal exercise in observation. It keeps me from looking at the chart blindly without understanding what’s relevant or worth focusing on.
This practice sharpens your ability to read the tape — not by pressing buttons or taking trades, but by simply observing price behavior and developing an intuitive feel for what the market is doing in real time. Over time, that experience teaches you how to respond effectively when it matters.
Now, since we’ve approached this low without taking it, if I were in control of the market, at 10 o’clock I would first drive price up into the relatively equal highs, then bring it back down into the relatively equal lows — and potentially as far as this BISI here.
The Dollar index is expanding higher so the risk off is the flavor of the morning
respect to the NWOG on m5 candles just before 10 am starts spooling lower
So far, we’ve had about 20 handles of downside movement by 10 o’clock. It’s important not to look at moves like this and think, “I wish I would’ve caught that.” This is an exercise in building patience and self-control.
Moves like this occur often without the Fed’s involvement. But when you introduce the Fed, you also introduce uncertainty — you don’t know which side will move first. Being wrong on a day like this can turn against you quickly, and many new traders make it worse by being afraid to use stop losses. That’s a dangerous habit that exposes you to unnecessary risk, especially on days like today.
On the one-minute chart, you can see that the opportunity has already passed. Once price starts moving, it’s over — anything entered here would be chasing.
I would need at least one more up-close candle to align with the move before taking an entry. If this were a normal day without the Fed’s influence — not a day of jawboning or intervention — I’d look to get short during a move like this, but again, only after seeing an up-close candle to confirm timing.
It’s just taking New Week Opening Gaps (NWOGs) and connecting them to form a narrative — moving from one opening gap down to a previous new week opening gap. This level has been traded to and through multiple times, yet it continues to act like a magnet.
Because it’s algorithmic, the market will reprice back toward it to seek fair value. It has nothing to do with buying or selling pressure. If price can accelerate lower, we have another NWOG beneath it, but it doesn’t need to reach all the way down there. The midpoint between both gaps — my event horizon — is what I’m watching. I want to see if the market has the willingness to reach at least that midpoint.
I’ve mentioned that I believe the dollar may be attempting to return to the volume imbalance on the daily chart. It appears that way — we’ve had this long, drawn-out consolidation, which can be frustrating, but the expectation is for the dollar to climb into that imbalance.
That would imply a longer-term outlook of bearishness for equities and foreign currencies.
We’re at that crossroads right now where the dollar has reached into a buy-side liquidity pool and back into a rejection block — and it’s done so in a straight, one-directional move.
At the same time, we’ve pierced and traded through the lower, close-proximity new week opening gap down here. This is the level we’ve been working toward for this week.
5 minute SIBI that I have mentioned earlier
I like to use the Dow as a barometer — much like the U.S. Dollar Index serves for other markets. When I’m analyzing the indices, whether it’s the NASDAQ or the ES, I refer to the Dow for purposes of SMT (Smart Money Technique) comparison — specifically to compare highs and lows between them.
So, from one New Week Opening Gap to another, price has indeed been delivered algorithmically — yes — but with manual intervention. They pushed it sharply and suddenly in one direction.
Now, my question to you is this: are you saying that the market somehow “ran out of liquidity” and just randomly decided to drop straight down into an old Sunday opening gap?
Everything’s under control, even when there’s manual intervention. They’re still taking price to levels that I’ll eventually teach you about — levels that exist within the algorithmic framework.
The problem is, when intervention occurs, I can’t know which specific level they’ll target, because that decision is no longer governed by the algorithm alone. It’s being influenced manually.
And since I can’t determine with high probability what they’ll choose to do — for example, whether they’ll deliver price to a buy-side or sell-side pool — I step aside.
Often, whatever the Fed Chairman says — even if it’s in line or not in line with expectations — can move markets in unpredictable ways. You’ll see fundamental analysts say things like:
“If the Fed is hawkish, the market will drop; if it’s dovish, it’ll rally.”
But what happens? The opposite often unfolds. Then, after the fact, they’ll say,
“Well, it was already priced in.”
Yet no one said that beforehand.
That’s the difference between reactionary logic and anticipatory understanding. I’m looking for signatures — structural reasons within price action — to justify why I believe price will move to a certain level. And on normal, uninfluenced days, those signatures are usually precise.
That’s why I focus my efforts on those conditions, rather than trying to force predictions during periods of manual control.
That way, the probabilities are in your favor — or at least, in my favor as the analyst. Because if the analyst isn’t correct, then the trader relying on that analysis won’t be accurate either.
It all circles back to you knowing what you’re looking for, when you’re looking for it, and whether the environmentyou’re operating in is actually conducive to high-probability setups in the first place.
Whenever you have the Federal Reserve speaking — whether it’s a press conference, testimony, or rate announcement — the market is in a state of artificial influence. That environment completely distorts probabilities. It’s the equivalent of a rate decision day where you don’t know the outcome or the immediate effects on price.
People will always have opinions —
“They’ll cut rates.”
“They’ll hold rates.”
“They’ll hike rates.”
But none of those opinions matter. They have no bearing on what the market will actually do.
Because, in the end, the market will reprice however it wants — regardless of forecasts, opinions, or crowd sentiment. It’s not the number of buyers or sellers that drives price; it’s how the algorithm decides to book price delivery.
What I’m actually looking at is the Dollar Index — starting with the 5-minute chart, then scrolling through the 15-minute and 1-hour charts, monitoring whether it continues to show a willingness to push higher. So far, it hasn’t made a higher high than the most recent swing high — and that’s problematic for the ES continuing lower, at least in the near term.
So for now, we’re just observing price delivery on the ES.
If we look at the Dow, it has made a lower low, whereas the ES has not. When you see that kind of divergence, it raises concern for either consolidation or a potential short-term reversal.
Many times — on a normal day without the Fed’s influence — if I were already short and saw a situation like this, where the Dow makes a lower low but the NASDAQ and ES fail to do the same, that would be my cue to start scaling out more of my position.
Because what that tells me is: there’s a chance the market could retrace higher against my position.
These are the kinds of inter-market relationships and subtle divergences that I weigh carefully as price delivers.
watching to see this fair value gap become support
what I do on days like this I'm not pushing a button even in demo
Now, in real time, I walked you through the idea of those lows not being confirmed. Okay, so that number I was telling you about — if I were in a trade, I’d have most of my position taken off by now. And this is generally where I’d be getting stopped out — my stop would be around this high here, trailed lower, if it were a regular day.
We have a buy-side imbalance and sell-side inefficiency measured from this candle’s high to this candle’s low — that one large candle in the middle, with all that movement. You’re looking at this high and that low.
The midpoint between these two reference points is the consequent encouragement, because it’s an inefficiency or a gap.
If it were an order block, then the midpoint would be called the mean threshold — but since this is an inefficiency, we refer to it as the consequent encouragement.
we have two discount arrays here - a BISI and a IFVG+
on any other day, I would utilize that as a long to get up to SIBI marked in red as a 10 am run target
👉
So watch and see if it delivers from here up to SIBI marked in red.
If you have the benefit of toggling between the DXY (Dollar Index) and your main chart, do that — use the 1-minute chart.
What you want to see is the Dollar Index not rallying; it can stay consolidated, or preferably, move lower.
Watch this wick — you don’t want to see it trade below the midpoint of that consequent encouragement.
It can touch the IFVG again, but I’d rather see it not do that, because it’s already done so once.
The risk would be on this candle’s low.
See where the bodies are forming — the wicks can do the damage; they can trade outside the lines.
But it’s the bodies of the candles that I’m monitoring and watching closely.
1 minute bearish breaker and a SIBI inside the same range for Dixie (DXY) - that’s very good for our long idea on ES
So you can see in real time — that’s five handles so far. Take a screenshot — the short-term high has been taken out and yielded.
there's the breaker outline we talked about inside that breaker there is a SIBI and daily rejection block
Lower dollar means risk-on, which generally means higher prices for ES (S&P 500).
In other words:
- When the U.S. Dollar Index (DXY) moves lower → investors are more willing to take risk → equities like the ES(S&P futures) tend to rise.
- Conversely, a stronger dollar typically signals risk-off behavior → investors move to safety → equities often drop.
So, in between those two heavy blue lines, the bodies of the candles are telling the narrative — they’re showing that price is respecting this imbalance. After that confirmation, price moves to a premium level, and the nearest premium in this context is that swing high. From there, the next point of interest becomes the imbalance above that level.
The projection from this low to this high, using a Fibonacci retracement, was simply to build a confluence of levels to gauge how far this pullback might extend. But on a day like this, you would ideally have the bulk of your position taken off within that first premium zone right here.
Keep learning with us.
Get new ICT lessons, study notes and updates as we build V2.