
Live Tape Reading - Baseline 1 of 3 - March 06, 2023
01:37 - Today’s Topic: Audio. 03:58 - The first of three baseline measurements for you. 09:25 - How to use a paper trading account.
URL: https://www.youtube.com/live/n37ozsUreR0?si=6lxLjVCaHTd6kxob Watched Date: March 6, 2023
Outline
01:37 - Today’s Topic: Audio.
03:58 - The first of three baseline measurements for you.
09:25 - How to use a paper trading account.
15:33 - The first few minutes of trading -.
20:37 - What’s going to be a hard week for traders.
27:31 - Opening range and wage gap.
33:55 - How to be fearful of losing and be emotionally attached to the outcome -.
38:56 - What does it look like to be in high resistance liquidity runs?
44:44 - Partial trading is the stupidest thing.
51:58 - How to manage risk -.
56:39 - The fear of a gap and the dollar index.
01:01:13 - What to look for in price action -.
01:06:33 - Don’t be afraid to fail.
01:12:28 - Dollar index and the dollar index.
01:18:03 - Low resistance liquidity runs -.
01:23:03 - Don’t try to frame your trading ideas as your own -.
01:29:32 - US vs US 500 vs. ES futures.
The first of three baseline measurements for you as a student this year is to observe your ability to capture, regain, and mitigate drawdown.
This is a way for you to determine your growth. There’s no better measure of how much you’ve learned than being placed in a laboratory experiment and given the real essence of measuring your understanding of how to recapture or mitigate drawdown. Obviously, as a trader—whether you’re speculating in a demo, paper trading, or a live funded account—you’re going to make mistakes. Inevitably, you’ll do something incorrectly.
You try to do this to learn a skill set that can hopefully be translated into speculating and profiting with live funds.
Tape reading is not the same as trading with live funds. Live funds incur taxation if you make money and monetary loss if you don’t. When you’re training and studying, tape reading removes that entire problem.
While you’re learning, it’s not about measuring profit or loss; it’s about measuring your ability and attitude as a student. Unfortunately, many try to measure their skillset far too early.
To encourage you at the beginning — this first baseline — you may fail this laboratory experiment. In fact, it’s almost certain you will. This week is Non-Farm Payroll week. We also have two sessions where the Fed Chairman will testify. I purposely chose this week because it mirrors exactly what happens when someone rushes into live trading before they’re ready. You’d be trading a week like this, thinking you have to pass your funded account challenge with only a couple days left.
These are the kinds of real-world pressures that push traders into making reckless decisions. That’s why you shouldn’t be trading real money until you have a cushion — ideally two years of living expenses saved. That way, you’re not pressured into thinking the very next trade has to be profitable just to survive.
If you put yourself in that position before you’re seasoned, before you’ve developed skill as a technician, you place enormous pressure on yourself. And that pressure is one of the biggest traps in this industry. If it’s not the “get rich quick” mentality, it’s the equally dangerous idea of “trade for a living” before you’re ready.
I’ve never pushed that message, because there’s a right way to do this.
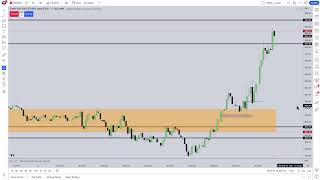
You can see how we created a short-term high here. Price was drawn back down below that New Week Opening Gap. It didn’t take out the sell-side liquidity below, but it did take out the buy-side liquidity above.
You’re never really trying to rush—especially today, since we had a big range expansion to the upside on the daily chart Friday. With the Fed Chairman speaking tomorrow and Wednesday, there isn’t likely to be much animation in the market today.
That doesn’t mean you can’t participate, and it doesn’t mean you can’t study and observe what price is doing—but you have to keep your expectations within reason.
So let’s take a look at why this might go back down into the New Week Opening Gap here, because we’ve already taken buy-side liquidity, and also examine the Dollar Index.
We’ve taken a sell-side liquidity pool here, and now there’s a small fair value gap. If price reaches that area, I’ll be watching—does it respect it, or does it trade right through?
On a day like today, I’m not interested in doing anything in the first few minutes just because the market opened. The opening bell doesn’t mean we rush in and place a trade. That’s gambling.
I’m looking at the relationship between the lows on the dollar to see if we can press higher. In the first few minutes after 9:30, I’m watching price action to determine whether the market is tipping its hand and showing what it wants to reach for.
If pressed, I’d say that given how far and aggressively we’ve already moved to the upside, the next upside target is likely the new weekly opening gap. On this chart, that objective comes in around 4077.
So as I study price in these opening minutes, I want to see if that’s truly the draw. If so, down-close candles should act as support, holding price and fueling a continuous expansion upward—without reverting lower in the institutional order flow.
This fair value gap has been traded into, and the down-close candle should now act as support. If it does, price should look to expand higher. Should we break above this level, the next upside target would be 4077.
As long as we remain above the new weekly opening gap at 4052.5 this morning, the bias stays bullish. In line with that, we would also want to see the Dollar Index fail to push higher and instead trade lower, confirming the bullish case.
NQ chart
👉
A day like this is shaped by the calendar itself. With the Fed Chairman testifying in the coming days during a Non-Farm Payrolls week, it sets up a very challenging environment to navigate. And there’s no shame in admitting that.
m5 OB+ and m1 V.I.
So all of these candles here have consecutively closed down, which is equivalent to a five-minute down close candle. On top of the second bar, notice how we moved from the opening of this candle and extended in time, which also led to another discount array on lower timeframe chart —a volume imbalance.
A volume imbalance occurs when there’s a separation between any two or more candles where the bodies do not overlap or even meet. The bodies must overlap or touch; if they don’t, that signals a volume imbalance. When this happens, price is more likely to return to that level. Preferably, you want to see a body laid across it—that’s the ideal confirmation. But in a fast market, you don’t necessarily need that. So far, this is what we have.
The Dollar Index is still struggling to break below its intraday low, and so far, we haven’t seen much meaningful development. So how would I coach you on using a day like today, when conditions are unclear and expectations are uncertain—not just after the fact?
👉
You want to wait through the first 30 minutes and then focus on the 10 o’clock hour. Study what the first macro move does between 9:50 and 10:10. Remember, macro is algorithmic—what some people call the market running for liquidity or inefficiency. By that time, if the market hasn’t shown much, it usually reveals its hand and gives us a clue about what it’s likely to do heading into the lunch session or around 11 o’clock to the noon.
We want to see -1 STD first and then NWOG higher around -2.5 STD
Look at this low and this high. Halfway between them, one standard deviation lower is here at negative one. I want to see if price has the willingness to reach this level. Ultimately, I want to see if it gravitates toward it. But we need to measure the speed at which price approaches this level. How price trades at this level (-1 STD), if it reacts at all, will indicate how it’s likely to behave once we move into the rest of the range.
👉
One of the hardest things you’ll face as a trader is the impulse to act—wanting to do something just for the sake of it. But taking action without knowing exactly what you’re engaging with, or what you’re speculating on, is dangerous. You need a clear premise and strong foundations for why price should move a certain way.
Looking at this, there’s really nothing compelling except that in the first few minutes, price traded down into a fair value gap on the 5-minute chart.
So the buy stops resting above this short-term high have been engaged multiple times—not just once, but twice. Has price shown any willingness to break away and start running higher? Not yet. It hasn’t rejected that high; instead, it’s behaving like a turtle soup— a false breakout—threatening to collapse back below this very fair value gap. Not yet confirmed.
Fear of missing out—that goes away this year, because you’re going to learn how to be in better control of yourself and your impulses as a trader and speculator.
Look what I’m watching here: price is making another attempt to reach a higher high, but on the Dollar Index I’m not seeing the same thing with lower prices. They should both move in symmetry—if the ES is spreading higher, the Dollar Index should be reflecting risk-on by moving lower. Are we seeing that in the Dollar Index yet? No, it’s stagnant. That means we’re in a very lethargic opening range. The opening range is always the first 30 minutes of trading, from 9:30 to 10:00. It never morphs into anything else.
During the first few minutes after the opening bell at 9:30, you want to reference where the market last closed. On Friday, this was our closing level in the day session (virtual trading session numbers). Then we opened here, rallied up, and already ran the buy-side liquidity. But notice what hasn’t confirmed yet—the Dollar Index hasn’t made the expected lower low. That suggests a likely pullback into the opening range gap.
The opening range gap is always defined at the 9:30 opening bell as the difference between the very first opening price and the previous session’s close.
So as of right now, we’ve been trading for 22 minutes and not much has happened yet. This is one of the lessons you learn from tape reading for months—not just a week—before thinking, “Okay, I need to be in here demonstrating because I have to be doing something.”
If you jump in with a small live account before you actually know how to trade or read the marketplace, you’re not really learning—you’re just learning to fear losing. That emotional attachment to outcomes is exactly what trading live money too soon creates. Anyone telling you otherwise is giving you bad advice, period.
That’s a perfect recipe for becoming afraid of trading, afraid of the next setup, and even more shaken by a losing trade. Why? Because you never conditioned or desensitized yourself to the outcome. Trading live before you’re consistent wires your mind to fear the result of every trade. And your number one task as a trader is to overcome that fear and remove it.
The way you do that is by studying price action so thoroughly that the setups become boringly familiar. You also train yourself to recognize when conditions are unlikely to create a big move, so you don’t feel regret over not being a participant. This is how you strip away the fear and replace it with confidence.
Market symmetry stance: if we take out this low on the dollar, everything becomes balanced. That creates a symmetrical market. From there, the market would need to generate real momentum to drive any meaningful move.
Let’s hypothetically refer to the economic calendar. Tomorrow morning, and again on Wednesday morning, Fed Chairman Powell will be testifying.
Right now, many market participants have their hands in their pockets, simply waiting to see how the chips fall over the next two days. Meanwhile, gamblers — the high-energy, caffeine-driven types — are out there chomping at the bit. They’ll tell you this is the time to trade, the time to gamble.
Those who are serious about learning self-control and measured risk don’t rush into these environments. They sit back and wait.
It’s the first mouse that gets caught in the trap; the second mouse gets the cheese. You don’t want to be the first mouse. Let the market reveal its hand. There’s plenty of time — over the month, the week, and the year — to witness incredible price runs.
You’re noticing there are certain price runs I’m not personally interested in. And you can’t just hear me say, “I’m looking for low resistance liquidity runs” without knowing what that actually means.
That’s what you’re learning—what it feels like, what it looks like, and what conditions create high resistance liquidity runs.
If I only went live during low resistance liquidity run conditions, you’d see me call the market, watch it run straight into my targets, and barely see any drawdown. But you wouldn’t learn much. Because without exposure to HRLR conditions, you wouldn’t know how to identify, handle, or endure them.
I’ve mentioned the characteristics that lead to a high resistance liquidity run (HRLR) condition.
Yes, the market is moving, and yes, it can still reach targets—but these are conditions I choose to opt out of. I don’t want to participate in those days.
You, however, are going to experience them, so you can gain an appreciation for the difference. When you’re not in HRLR conditions, the market behaves differently—it quickly runs from one pool of liquidity to the next, or from a premium array to the opposing discount array. It does this cleanly, efficiently, and without hesitation.
What you’re seeing here instead is classic HRLR behavior: the market is in no hurry.
👉
In high resistance liquidity run (HRLR) conditions, the market is in no hurry to reach an opposing discount or premium array.
Because liquidity or inefficiency is encapsulated by that idea.
In a low resistance liquidity run (LRLR) environment, the market is in a hurry, moving quickly to reach its target. That’s the distinction: HRLR is slow, indecisive, while LRLR is fast and efficient in delivery.
This distinction helps filter out environments most likely to produce choppy days, where most traders get beat up.
Invariably, on the days I’m teaching you that it’s going to be high resistance, we remain reserved. We’re not in here trying to push, push, push. Instead, we’re being very selective about what we expect in price action.
When are you going to move your stop loss? When are you going to start reducing risk with it? When will you move it to breakeven? Every trader grows at their own pace. My teaching style helps by taking the worry out of managing the stop loss.
The stop loss has a job, and it’s already paid to do that job—remove you from further risk. If price hits it, it did exactly what it was supposed to do. That doesn’t mean your method failed, or that you’re a terrible trader, or that your logic is flawed. It just means you made a human error, a misjudgment, and lost on that single transaction. It’s like getting a flat tire on the way to work—it’s just the cost of doing business.
We’re not looking for price to simply move in our favor so we can instantly remove risk. What we’re doing is studying the trade, waiting for price to reach an opportunity where we can take partials off and manage it properly.
I've never understood the argument against taking partials, because you never know if your model and execution will reach a full profitable exit. If you’re only holding for the final target at Terminus, it becomes all or nothing. As an educator, it would be foolish for me—or anyone teaching this—to say, “Hold for your full target or nothing at all.”
Number one, it’s discouraging when you get stopped out, especially in the early stages when you don’t fully understand what you’re doing. If the trade offered a chance to take something off, why ignore it? That partial is like your white belt in martial arts. Opening a trade is the start. Taking your first partial is your green or yellow belt. Your second partial is your blue or brown belt. And reaching Terminus is the black belt. But each new trade starts you back at white belt again.
Unfortunately, the Western mindset demands constant recognition—similar to how martial arts schools hand out belt colors as rewards. Trading works the same way. You need milestones, and partials provide them. A partial profit has never failed—it always pays, every single time. That’s perfect trading in itself.
The critics who dismiss partials don’t know if their current trade—or the next one—will ever reach full target. They expose themselves to full initial risk, hoping to reduce it later, but often without locking anything in. That’s the trap of the retail mindset.
I'm watching to see if we expand to the upside here. Since the dollar just broke, this should start to gravitate upward into that level.
The idea of taking something off partially is that you are paying yourself. You’ve put time, emotion, energy, and mental equity into the charts, stressing and waiting. When the market presents an opportunity for you to take something off and get paid, why wouldn’t you?
It’s like working half the week, then getting sick and missing the rest, and telling your boss, “Don’t pay me for the days I did work since I didn’t finish the whole week.” Nobody would do that. Yet in this industry, some say partials are stupid, don’t ever take them. But their results prove otherwise. They’re not hitting full targets—they’re getting stopped out and losing far more than they would if they had taken partials.
I’ve shown this many times, even in my tape reading sessions two weeks ago. The markets have been very fickle, very difficult, not because the algorithm has changed but because price is constrained and not wanting to move. That’s why I emphasize partials—when I say “take a partial here,” mark it on your chart, screenshot it, and note it. I’m conditioning you to do exactly what you’re trying to learn: how to pay yourself as the trade unfolds.
They’ll say, “Hold for your target or you don’t have conviction in your model.”
No—my model says get out with money. Get out where the market offers it to me.
If your model says, “I’m always right or I get nothing if it gets stopped out,” that’s foolish. And it should sound foolish to you as well. Why? Because you’re putting in all the time, opening yourself up to risk, and when the market gives you an opportunity to get paid—you take it.
Right now, this would be a perfect opportunity. If you had gone long on that 5 minute fair value gap (BISI) , or when it traded into this down-close candle(5 minute OB+), this move gave you five handles.
That’s a perfect opportunity—even though it hasn’t yet hit the new week opening gap—to take a partial.
Because you don’t know if a bomb is going to drop somewhere, or some chaos breaks out in the country or the world, sending price harshly in the opposite direction. You don’t know that. I don’t know that.
I teach my students not to be worrisome or overly concerned about the stop loss. It’s there to do its job. Your focus should be on whether price reaches a level that allows you to do what? Get paid. If you can get paid, that’s what makes your bottom line grow—not being perfect, not always hitting the full target.
Taking partials is one of the hardest lessons for new students or traders to accept. But it makes no difference whether your ultimate target is reached or not—the real goal is to add consistently to your bottom line. When the market presents an opportunity, unless you take a partial, the market won’t do it for you.
There have been many times—even just a few weeks back—you saw me openly share my limit order where I expected to exit. The spread between the bid and ask on the S&P prevented my limit order from being filled. The candle’s high actually touched my level, but I didn’t get filled, and price pulled back against me, leaving me only with my final balance of one contract.
You don’t know if your target is going to be hit. But when the market is basically flashing a billboard that says “Here’s money, right here”—all you need to do is scale out something—you must take it. If you refuse, it’s because of greed. And what I’m teaching you is how to manage that greed.
By taking something off at logical points and repeating that process over time, you condition yourself. You begin to remove that false necessity in your mind that says, “I have to be right, I must be perfect, or I’m not a real trader.” No. You’re a good trader if you manage risk, stick to your rules, and consistently put profits on your bottom line when they’re offered to you.
Targets are simply the best-case scenario. There’s absolutely nothing—about my trades, your trades, or anyone else’s—that guarantees those targets will be reached. We don’t know. We’re only submitting to the idea of likelihood, not certainty. And especially in today’s market conditions—which are extremely difficult—certainty doesn’t exist.
We see a fair value gap here, with the short-term high taken. Price trades back down into a down-close candle, which could serve as a potential bullish order block. The mean threshold is at the midpoint of that down-close candle—does price find support at that level?
At the same time, we were watching the Dollar Index. There, we were focused on a sell-side liquidity pool, looking for price to move lower through that low. If it does, it signals more risk-on conditions, allowing ES to trade higher—up into the next new week opening gap, located above.
So we don’t need 4077 to be traded to — why?
Because we had already identified a level, using our Fibonacci Projection, that signaled a fair area to take a partial, without requiring that upper level to be reached or taken out.
This NWOG between 4077 and 4084 acts as the magnet for price action.
However, since we are still trading below it, the first threshold to focus on is the low of the next new week opening gap, relative to our current position in price action — and that next one is here.
If you’re trying to learn how to read price action — this is how you do it. There is no other way.
There’s no video I can produce, no book I can write, no number of chapters — I could publish twenty books and it still wouldn’t teach you what you learn from watching it unfold in real time while it’s being explained.
Static charts or hindsight reviews can’t replicate it. Even Market Replay isn’t the same, because with replay, you already know what’s coming. That knowledge changes how you see price action — it removes uncertainty, which is the essence of live study.
When you’re watching this, you have no idea how each candle will form, yet I’m drawing your attention to specific details: why price should behave a certain way, what I’m measuring it against, and how to interpret it.
I don’t use indicators — I focus on the relationship between the Dollar Index and the ES, alongside other correlated markets displayed across the eight monitors in front of me. All that data builds a complete, real-time narrative of price delivery.
We had to shift our attention to the Dollar Index — it became the focal point.
We were watching to see whether the dollar wanted to go down below this low. It did, and the key question was: does it show a willingness to stay below that level without any intention of returning? That’s what we want to see — a decisive drive lower.
If that happens, then we can trust that this new week opening gap will remain a valid draw on liquidity.
But do we just buy and hold for that target? You can, but that’s how most people trade — reacting emotionally, full of stress, without the precision of a trained speculator.
Instead, focus on the order block logic: a down close candle is expected to support price. However, not every down close candle automatically qualifies as an order block. If price trades down into it, you don’t want to see it trade below its mean threshold — the midpoint of that candle’s range. That’s where the narrative confirms strength.
We’ve already reached 4077.
Now, we want to observe whether price begins to gravitate toward the consequent curtailment — the midpoint between the low and the high of the new week opening gap.
By this stage, 80% of your position should be taken off. A partial exit should have been executed within this range, locking in the majority of your profits.
At that point, your stop loss can be adjusted — either to breakeven or to a slightly better level, depending on your comfort and discretion.
In my opinion, your stop for the remaining 20% runner should rest just below the midpoint (equilibrium) of this current range of price action. That’s the logical area where the narrative would invalidate itself if broken.
I’ve just outlined what I’m specifically aiming for in price — the precise target I expect it to reach.
Now the key is trusting what confirms that price will continue driving toward that level. That trust comes from recognizing the factors currently in my favor, understanding what I’m looking for next, and clearly knowing what I don’t want to see in price action.
Everything that validates or invalidates the idea — all the confirmations and warnings — is embedded within the price action itself. That’s where the entire narrative unfolds.
When we’re in a slow market, it usually means the market is predisposed to adversity — periods of hesitation, false moves, and choppy conditions. This often happens because of the economic calendar.
In simple terms: Fed Chairman Powell is scheduled to speak tomorrow (Tuesday) and again on Wednesday. Because of that, a lot of traders and large funds are holding back — they’re not committing significant capital yet. When money stays on the sidelines, the result is a market with tight ranges and shallow fluctuations in price.
During these times, you must be nimble and avoid marrying the idea that the market will suddenly explode — 120 handles up or 40 handles down — because such large moves are unlikely today.
However, once Powell begins testifying, the situation shifts. His remarks create opportunities for market makers to exaggerate price movements and induce volatility. That’s why we expect bigger moves tomorrow, particularly around the 10 a.m. hour — both Tuesday and Wednesday should deliver significantly more volatility.
I want you to do this homework assignment — and I know it may sound completely absurd, but I promise you, it works. It helps you understand where you are in your development and learning process as a trader.
Here’s what I want you to do:
Paper trade the E-mini S&P (ES). The position size doesn’t matter — trade as you normally would.
Your objective is this:
- Start with a $150,000 paper trading account.
- Intentionally draw that account down by about $3,000 today — aim to finish around $147,000. Don’t exceed a $3,000 drawdown, but get as close to it as possible.
Once that’s done, your assignment before Friday’s close is to bring that account back up to $150,000.
However, there’s a catch — if your balance drops below $144,000 at any point, you fail the exercise, do not be afraid to fail. The whole purpose is this is as a baseline.
Before we reach November, which marks the end of this daily mentorship, I’ll have you do this exercise again. By then, you’ll clearly see the ability and progress you’ve developed — the growth you’ll have by November compared to where you are right now. You may not notice it day by day, but when measured, the improvement will be undeniable.
If you’ve learned and truly understand more, you’ll be able to perform better. I’m intentionally choosing this week because it’s difficult — it mirrors real-world trading conditions. You’ll feel the urge to chase big moves, especially when everyone is talking about volatility surrounding the Fed Chairman’s testimony. Everyone wants to be part of those explosive days.
But those big volatile days often bring maximum loss days.
So when you ask, “How do I recover from drawdown? How do I overcome the fear of losing? How do I navigate when I’m down?” — this is how.
You must let yourself fail here, in your paper trading account. Experience it, see it, and then work to fix it using what you know now. Later, you’ll compare it with what you’ve learned — and the growth will be undeniable.
Notice I didn’t say create a fake $3,000 drawdown and fix it today. I said this week. That’s the proper mindset for correcting drawdown — not, “I hurt myself, I need to fix it right now.”
You don’t fix it out of embarrassment or shame, or because you’re worried someone might ask about your results. You don’t need to hide or feel humiliated that you made a mistake — that’s part of being human.
Every trader loses money. Every trader gets it wrong. Even with my own concepts, there are times I try to finesse things, times my ego slips in and I think I can outperform. That’s normal. It’ll happen to you too.
There is no perfect trader, no flawless system, no unbreakable strategy — and that’s exactly why this process matters.
You treat your trading education as a fresh start, allowing yourself — as a student and trader in development — to be fallible. You’re going to make mistakes. You’re going to mess up. You’ll hurt yourself, you’ll do dumb things. You’ll look at the market expecting it to go higher, and it won’t. It’ll go lower, and you won’t have participated.
How do you avoid regretting that or chasing it? By knowing that the next moves will come. That’s what most traders on social media miss while chasing people like me, waiting for me to drop a breadcrumb.
I'm not trying to do that with you — I want you to be an independent thinker. This business is won by developing an understanding of what is likely to occur, then looking for evidence to support that idea and submitting to it, even if it’s uncomfortable. And you have to submit to time.
Time being 10:30 now, it has reached our new week opening gap.
ES drops down into a fair value gap, clearing relatively equal lows here.
At the same time, the Dow was not willing to make a comparable lower low.
This is an SMT divergence, reflecting an accumulation of longs.
However, you can’t take this in isolation — you must also weigh risk-on versus risk-off sentiment, which acts as the rocket fuel behind your trades.
If you’re going long on ES or NASDAQ, you want to see the Dollar Index moving lower. You do not want to see the Dollar Index rally.
It can consolidate while index futures rise, but such moves are often quickly corrected once the dollar resumes strength.
The Dollar Index is a powerful instrument for gauging whether your trade will deliver efficiently and swiftly toward your target — or if it will struggle when the dollar’s movement isn’t in alignment.
If we look at the Dollar Index, it should be lower — and it has been — but now notice how we’re coming off the lowshere.
Price is rising within this range, showing balance through time efficiency.
Retail traders often interpret this as a support level that’s been broken and should now act as resistance.
I don’t subscribe to that — it’s far too myopic.
Instead, what we’re likely seeing is a move up toward the consequent curtailment of a failed lower low on the Dollar Index, followed by some consolidation into the lunch session.
That’s my interpretation, and it’s what I’d expect given today’s limited movement.
Why?
Because the market is anticipating Fed Chair Powell’s testimony tomorrow morning, and participants are holding back ahead of that event.
Look at the entire weekly calendar — where are the big, heavy stones in terms of high- or medium-impact news events?
For instance, if the Fed Chair is scheduled to speak, that alone will shape how the weekly range is delivered and how each daily range forms.
Those events determine whether price action will be one-sided and impulsive or slow and high-resistance, like what we’re seeing here.
This is not a low-resistance liquidity run, even though it performed well and reached the objectives we outlined — it simply took much longer to get there.
And I’m not trying to teach you impatience.
The very things you’re yearning for right now — those fast, sudden price runs that hit your target quickly so you can exit without holding risk — are symptoms of limited understanding.
I understand that urge intimately.
When I was younger, I was extremely impatient — I only wanted to be in trades that ran immediately in my favor, reached target fast, and allowed me to exit without stress.
But that kind of mindset eventually breaks you.
I used to run a thousand scenarios in my head:
- “What if it hits my stop?”
- “What if it doesn’t reach my target?”
- “What if it just sits here all day or overnight?”
As a former commodity trader, holding positions overnight was mentally exhausting.
It didn’t suit my personality — I’m decisive by nature, quick to make calls — but markets don’t reward haste.
They reward patience, observation, and control.
I’m not saying you can’t find trades in high-resistance liquidity run signatures — you absolutely can.
I just don’t like them because I prefer trades that “tear off” right from my entry and run directly into my partials or targets so I can be finished quickly.
That quick, sudden, immediate feedback makes it exciting — almost like a treasure hunt. I’m always looking for that. And these types of moves are not hidden from you; they’re visible and, as you’ve seen this morning, they’ve been outlined for you.
But that’s not the same as a low-resistance liquidity run.
Low-resistance means there’s nothing obstructing speed.
Whereas this environment, because of the economic calendar — with two Fed Chairman testimonies on Tuesday and Wednesday — plus it being the first day of the week, there simply isn’t much excitement right now.
So what do you do?
You allow the market to seek fair value.
Fair value is shown with tools like the fair value gap, yes — but from a large fund level, “fair value” means price levels that inspire new order flow. These levels are engineered to remove or replace liquidity, often through mechanisms like the new week opening gap or the opening range gap.
That’s why, when I first began teaching this back in February, I emphasized dividing this range into four quadrants — it’s the foundational premise of understanding how these levels operate.
Low resistance — what does that actually mean? What’s the resistance factor, and what’s causing it?
When I talk about resistance, I’m referring to resistance in speed — not resistance at a price level. Whenever you’ve seen me annotate a chart and say, “I’m looking for speed and distance,” that’s me describing a low-resistance price run.
It doesn’t mean I expect price to hit a resistance level and reverse lower.
It means that in a high-resistance liquidity run, price can still reach the intended target — but the delivery is slow and messy. It’ll push up, retrace deeply, consolidate, push again, retrace again, maybe go sideways… that’s high resistance.
It’s not that price is “resisted” by a certain level — it’s that it’s resisted in time and speed. The delivery speed is what I care about. I want to see speed.
If the trade has speed behind it — if there’s momentum and flow — then that’s low resistance. There’s nothing restricting the move from one point (say, from this order block to that target) in terms of time.
In a low-resistance liquidity run, price would move from here to there in just two or three candles — versus dozens in a high-resistance condition.
You can trade profitably in high-resistance runs. Absolutely.
I just personally prefer not to — they bore me.
I enjoy trades that are quick, sharp, and decisive — the kind that feel like a word search or crossword puzzle: quick recognition, fast reaction, and clear delivery. That’s exciting.
For new students, though, these slow, high-resistance markets can feel painful — like watching grass grow. But when you finally experience a true low-resistance liquidity run, you’ll know it instantly.
It’s fast.
It’s clean.
It doesn’t waste time.
It just goes.
And if you’re on board when it happens — it’s one of the most fun experiences in trading.
These slower conditions can still deliver to targets, and you can absolutely make money trading them. But personally, I’d rather wait for the fast ones — the low-resistance runs.
If you trade in line with how I teach — how price actually moves — even retail setups will work.
The problem is, retail logic doesn’t rely on or align with the concepts I’m teaching, because most retail traders don’t believe that there’s something orchestrating or controlling price delivery.
So now, because we’ve reached that level, we want to see the dollar make a lower low.
We’ve gone through the consequent encroachment, and as I mentioned, we’ve likely formed a higher low, which suggests we’ll probably consolidate for the rest of the morning going into lunch — that’s how I’d interpret this session.
Why? Because the dollar has not made a higher high, and the ES hasn’t made a lower low — its current low is higher than the previous one.
In a perfectly symmetrical market, the dollar should be forming a lower low while the ES makes a higher high — but that isn’t happening.
Whenever I see that kind of asymmetry or decoupling, I’d close the entire position and be out of the trade completely.
We’re moving into the 11 o’clock hour, and I’d be comfortable taking the trade off here. Even if price continues to the 4084 level, I don’t care — and you shouldn’t either. You want to condition yourself to detach emotionally like that.
Why shouldn’t you care? Because the trade would have been taken from the order block I outlined earlier — the down close candle that should begin supporting price. Price rallied up as the dollar moved lower, and everything aligned perfectly.
Once we reached the 4077 level, 80% of the trade should come off. Why? Because there’s still potential weakness in the dollar. You can trade with the consequent encroachment and a higher low — that’s my signal to say, “Okay, I’m done.”
If it weren’t for the Fed Chairman speaking tomorrow and Wednesday, I wouldn’t have taken 80% off here. Instead, I would have taken 50% at this level, another 25% higher, leaving a final 25% runner to trail.
I’m giving you a lot of insight into how I internalize price, where and why I take partials, and how I submit to price action through the entire process — everything I’ve walked you through this morning.
Keep learning with us.
Get new ICT lessons, study notes and updates as we build V2.