
ES Session Review - February 15, 2023
01:35 - E-mini S&P/March delivery contract for 2023. 03:33 - What is the New Day Gap? 07:32 - Where do you start? -.
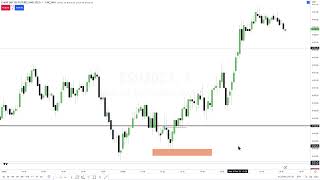
URL: https://www.youtube.com/live/SSWN6YSVyFY?si=5ix_0TGRPTwyEuxf Watched Date: February 15, 2023
Outline
01:35 - E-mini S&P/March delivery contract for 2023.
03:33 - What is the New Day Gap?
07:32 - Where do you start? -.
13:44 - When did this run occur going into the 7:30 hour?
19:05 - Do everything you see me doing with tradingview with your trading platform.
24:59 - What happens when the market consolidates going into the 30 hour.
30:49 - The relationship between confirmed higher highs and higher lows.
35:49 - Why does this even work?
42:00 - The low of the new week opening gap -.
47:37 - What’s a spooling program?
51:52 - Why the market is going to rally once it starts rallying every down close candle.
56:49 - Short selling, short selling, selling, buying, buying.
01:01:56 - Why you should fear overtrading over leveraging -.
You can trade Forex around seven o'clock and nine o'clock in the morning. If I suspect that the market is going to be problematic for me—meaning that it’s either going to be very hard to read, and I’m expecting that because of some news driver coming the next day or later in the afternoon, like FOMC—I will adopt the 7:00 to 8:30 time window if I want to trade pre-market.
So, before the 8:30 news driver comes (by news driver, I mean any kind of report, data release, or medium- to high-impact news event that usually comes out around 8:30 New York local time), if I like the market structure that’s in play from 7:00 going into 8:30, I have no fear of getting in a trade and using the 8:30 hour to roll right into my targets.
That’s what I showed this morning on Twitter: I went through the preamble explaining why I felt the Dollar Index was likely to go higher, why I expected the foreign currencies to go lower, and why ES would also go lower. My bias was bearish. I pointed out that Forex and equities like ES would seek sell side, and I prompted you to look at your chart for the New Day Opening Gap.
This whole run right here, right to that price point, set the stage for me to trust that I could find a setup before the 9:30 opening. I had already anticipated that the 9:30 opening and the rest of today’s session would be lethargic, choppy, and range-bound. Can you trade in that? Absolutely. Do I prefer to? No. Can I do it? Yes.
Because I saw this in the morning and started the breakdown, I was watching the low of the previous week’s New Week Opening Gap. When we ran up to the New Day Opening Gap—which, for your notes, is the closing price at 5:00 PM and the new opening price at 6:00 PM (the one-hour gap that futures have every day in the evening)—that difference, whatever it is, several handles or even one tick, needs to be annotated on your chart throughout the day. It’s a reference point that the algorithm will return to.
From 7:00 AM to 8:30 AM, if I anticipate difficult trading, consolidation, or low-probability conditions, that’s my green light. I’m probably going to take something before then. This morning, you were prompted to look for sell-side in futures and higher prices in Dollar. I gave you the bias and the premise of what I was looking for. After that, I engaged in demo executions. I watched for the market to move away from the New Day Opening Gap, which it did, and then waited for it to trade down to the low of the previous week’s New Week Opening Gap.
This whole run right here, right to that price point, set the stage for me to trust that I could find a setup before the 9:30 opening. I had already anticipated that the 9:30 opening and the rest of today’s session would be lethargic, choppy, and range-bound. Can you trade in that? Absolutely. Do I prefer to? No. Can I do it? Yes.
Because I saw this in the morning and started the breakdown, I was watching the low of the previous week’s New Week Opening Gap. When we ran up to the New Day Opening Gap—which, for your notes, is the closing price at 5:00 PM and the new opening price at 6:00 PM (the one-hour gap that futures have every day in the evening)—that difference, whatever it is, several handles or even one tick, needs to be annotated on your chart throughout the day. It’s a reference point that the algorithm will return to.
From 7:00 AM to 8:30 AM, if I anticipate difficult trading, consolidation, or low-probability conditions, that’s my green light. I’m probably going to take something before then. This morning, you were prompted to look for sell-side in futures and higher prices in Dollar. I gave you the bias and the premise of what I was looking for. After that, I engaged in demo executions. I watched for the market to move away from the New Day Opening Gap, which it did, and then waited for it to trade down to the low of the previous week’s New Week Opening Gap.
When we’re looking for Order Blocks, remember: it’s about the change in the state of delivery. That’s what an Order Block truly is. It’s not about a single candle—it has nothing to do with the candle itself.
The market shifts its delivery rate here. Once it begins delivering to the sell side, and a Fair Value Gap is formed, your attention goes straight back to that opening price. The market will trade up into the Fair Value Gap—that’s where you want to take your entry. You allow price to retrace into that level.
Because if it does, you can enter there. But if you wait only for the Order Block and refuse to take anything inside the Fair Value Gap, sometimes the market won’t return to the block. The Fair Value Gap will be the only respected level—and the market will run away without you.
That can be frustrating. If you demand absolute to-the-tick precision for every execution, you will miss trades. The market will not always reach your ideal level. And if you’re too strict, your limit order won’t fill—and the move leaves without you. That’s why sometimes you must use a closer-proximity entry, even if it’s lower than your perfect “key” level.
Then we had this Fair Value Gap that formed. What kind of Fair Value Gap? SIBI. I knew in real time that I wanted to see this remain open. The market moved lower and attacked the sell side in here—all of this was setting up for the move going into 8:30.
The market consolidated into the 8:30 hour. I mentioned it would drop aggressively, sharply into the 8:30 News Hour. Whatever news event came out—I don’t even know what the data was. And honestly, I never care. You could offer me a billion dollars in cash to tell you what that report said, and I couldn’t. It doesn’t matter. What matters is the volatility that always comes in at that time.
Once I know I’m looking for a run, and I expect the 8:30 hour to deliver it—especially if I know the day will be range bound, consolidated, or choppy—then my work is done between 7:00 and 8:30. When the news driver kicks in, runs through the liquidity, and fills my order—like you saw on the video I shared on Twitter—I’m finished.
I’m not arm-wrestling the market for the rest of the day. I don’t care what happens after that. My analysis already told me it would be a difficult trading market. So why fight it? I get in early, before everyone else shows up. I eat when the food is fresh, then leave. Everyone else comes later, gets the stale bread, and wonders why it doesn’t taste good. They work harder for less.
Me? I’m in and out. That’s what you want to do.
We were watching these lows, and I was paying attention to the relationship between the NASDAQ lows and the Dow Jones futures contract lows. Eventually, a divergence formed between those three averages, but in time, they all moved lower. All of them confirmed that lower low. However, the dollar index did not.
These were all real-time analysis points I was calling out. I said, even though we now have a lower low across all three major averages—the NQ, the YM, and the ES—there was still SMT divergence because of the relationship to the dollar index.
The dollar index reveals risk on vs. risk off. If the dollar goes up, that’s risk off. That means Forex, bonds, foreign currencies, and index futures have more freedom to drop, and it becomes very difficult for them to rally higher. If the dollar index moves lower, that’s risk on. That means Forex, foreign currencies, and index futures can easily rally higher, and holding sell-side positions becomes much harder to profit from.
You have to build intermarket relationships where there’s a clear connection. Why do we even refer to the dollar? Because of risk on and risk off. If sentiment is going to change, the dollar index will usually reveal it first. When we saw the lows forming earlier, we were already cautious, because those lows felt suspect. The reason was simple—the dollar index failed to follow through. It did not make a higher high while ES, NASDAQ, and Dow futures all made new lower lows around 10:12 a.m. That failure created SMT divergence.
In a symmetrical market, you want alignment. For example, if ES makes a low, then a lower low, you’d expect NASDAQ and Dow to also form lower lows, while the dollar index makes a higher high. That’s a perfect correlation—everything is in sync. But the moment one of those pieces breaks, when the expected relationship fails, it’s signaling that sentiment is shifting in the market.
So you have to be able to measure things in real time. If you’re going to be a day trader and you want precision while trading with an institutional mindset, these are the tools and concepts you need. There are no indicators involved—what we’re doing is simply comparing one asset to another and studying its price delivery.
Why does this even work? Because every one of these instruments is driven by algorithms. The dollar index runs on an algorithm. The ES runs on an algorithm. The Dow runs on an algorithm. The NASDAQ runs on an algorithm. They each operate independently, but when they’re manipulated together, cracks in that correlation show up. And that crack is the signal for that Smart Money group to do their work. That’s why it’s happening.
A bullish breaker is a swing high located between two lows, with the most recent low going lower to take out sell stops. After that, the market rallies higher and trades through it. The signature to look for in price is the beefiest, highest up-close body candle. That candle represents the bullish breaker. Take the entire range from the low to the high, encapsulate it with a rectangle, and then drag that forward.
💡
3:15 pm and 3:45 pm last hour macro. It will run on liquidity that has not been engaged.
A buy program is not a market maker by design. It occurs when an algorithm begins executing buy-side orders, continuously pushing the price higher. It doesn’t matter how much buying or selling pressure exists; the market will move in that direction regardless of sentiment. You could be bearish, and everyone on message boards or forums could be shouting the same, but it won’t matter. The market will go where the algorithm dictates, and this can even happen with low volume, which challenges the conventional arguments about buying and selling pressure.
The market rallies from here and enters a buy program. A buy program occurs when the market begins consistently booking higher prices until it reaches a pool of liquidity. In this case, that could be a buy-side liquidity area or a premium inefficiency, such as the example shown here.
Repricing vs rebalancing
💡
A SIBI (sell-side imbalance buy-side inefficiency) means that the market initially offered only sell-side liquidity. For it to be repriced correctly and present an efficient fair value to the marketplace, the price will move upward toward that level. The market delivers it on an upward basis, offering it efficiently through the scope of fair value. This is not considered rebalancing; it is repricing. Once the market leaves this range, it becomes balanced, and it is then likely to support price without needing to return downward. This is the key distinction.
Once the market starts rallying, every down-close candle—or a series of consecutive down-close candles—should be considered as a single order block. This is because what matters is the delivery, not individual candles. A single candle does not create the narrative, nor does it define an order block. The order block is identified by the change in the state of delivery.
🚨
That candle’s opening price is 4145.75. As soon as the market trades one tick above that price, it becomes an order block.
Once this occurs on that candle, the opening price becomes fair value. This means that when the market trades through this level, it will create a smart money opportunity. When the price comes back down and touches it, they are buying it. Their algorithm, which operates at high frequency, is constantly hammering the market at these price points.
Every time we leave a down close candle, they are watching their positions move into profit. Each new change in the state of delivery offers them another opportunity to build their position and increase its size.
The focus is on relatively equal highs. This is where liquidity is drawn, and the market is likely to be pulled toward it. Why should it go up there? Because buy stops are located at that level, along with willing buyers who are ready to purchase at a higher price while the market is down here.
That’s new meat, flesh to be devoured. The market is the beast; it will consume the flesh dangling off the carcass above these highs. This is the life essence of the markets—it goes to where the orders are. There is no respect for your pattern, no respect for a down close candle you might be mistakenly calling an order block. The market is going to where the actual orders and inefficiencies exist. It constantly seeks liquidity and fair value, flowing back and forth to facilitate the most efficient model of price delivery. These price engines have no awareness of how many contracts are being bought or sold. They don’t even know how many contracts are resting above a level. They simply act: once it stops here and pulls away, every trader reacts the same way. This process is called priming.
👉
Priming is taking an action with the expectation that the audience, viewer, or participant will begin to anticipate a specific outcome. Once that hook is sunk in, the process is complete.
This becomes the 2022 model. Think low, lower low, sell sides taken. We're inside that time window between 15 minutes after three to 45 minutes after three, which is the closing of our final hour of trading. You're going to see a macro run to the liquidity that has not yet been engaged.
Within the context of a bullish market, which I outlined this morning, there is a change in the state of delivery: buy, buy, buy. Displacement occurs, the market structure shifts, and the overall bias is bullish.
That's where Smart Money engages. They're in early.
The 2020 model focuses on a shift in market structure after liquidity has been taken. The bias is bullish. Identify liquidity and aim for the buy-side liquidity. Do not attempt this with a very tight stop loss. You must secure your first profit before ever moving your stop to breakeven or close.
That’s normal. The market rallies and comes back into another fair value gap. It trades until it rallies, and when two down-close candles trade through it, that becomes an order block. This represents a change in the state of delivery, now delivering buy-side. The next candle opens, and the volume of balance at that open is expected to trade back down just to close that gap to the opening price. There is no trade into this candle; once the opening price is traded, smart money will buy there. What happens after that? It rallies—not because smart money bought it, not because there is more buying pressure—but because it is designed and coded to do so.
The final trading macro between 3:15 and 3:45 shows what’s actually occurring in the market. For those asking what makes this macro significant, it becomes clear when you consider a bullish market. After a big bull day, the market runs up to a high, then typically pulls off slightly, closing near the high but not at the high. If the market is pressing out of a consolidation, as I outlined this morning on the daily chart, it will begin probing outside those boundaries. I tipped you off on the side—it’s reaching for the highs because it had already tried multiple times to go lower, catching traders selling short.
Your focus should be looking up all day, especially in the final part of the session. By knowing the direction you’re trading and focusing on specific times of the day, you can take advantage of these macros. Between 3:15 and 3:45 PM New York local time, the market tends to create a price run as it approaches the end of the day. If a clear setup isn’t present, do nothing—wait until 15–20 minutes before 4:00 PM. Then you can often see a five- to eight-handle run, sometimes even ten handles.
This method of trading the final hour is systematic, generic, and even boring, but for a trader seeking consistency, it’s extremely reliable. It repeats over and over, making it hard to beat. Though it may sound overly scientific or like conjecture, anyone following this process over months will see their charts print exactly as taught. The market is coded to behave this way. No one in this group can argue against its algorithmic control, because the patterns are observable, consistent, and proven over time.
If the market is rigged, which it is, there's no reason to fear that. But you should fear overtrading, overleveraging, and pushing a mythical edge that you think exists with retail stuff. When you make money, it has nothing to do with you doing something right with a pattern; you just happen to be on the right side at that time and use proper money management. The money management is what makes most people profitable, not the actual trading.
Knowing when the market is likely to be difficult is crucial. If you anticipate the hard times, you won't be inclined to overtrade, overleverage, or chase losses in a rush to recover. Instead, you wait, which gives you peace of mind and absolute control over your trading—something most traders lack when they act recklessly.
Once you know what it is you're looking for and how you're going to engage it, you also need to understand the procedures and processes you go through while doing it. Equally important is knowing when to pull the plug—when to turn the charts off and walk away. This mentorship is about that mindset and discipline; it’s not simply buy here, sell here, stop here, target here, partial here.
I'm teaching you how to perceive price at its most opportune moments and avoid it when conditions aren’t right. You can study the market, but don’t touch it if it’s not in those conditions—it will hurt you. It’s like approaching a hot pan in the kitchen: you don’t know how long it’s been sitting there, so you cautiously bring your hand close to feel for heat without getting burned. As a child, you might have rushed in and touched it, getting burned immediately. That’s what many of you do when rushing into funded accounts, live accounts, or even demos. You’re fortifying toxic thinking and fear unnecessarily. You don’t need to fear trading; you need to respect the risks. Those instances where you are wrong are where you learn the most, yet by avoiding them, you defer any real learning.
You have to grow through some adversity, some pain, and the uncertainty that you’re naturally trying to avoid. You have to press into that. It becomes fun once you learn—suddenly you realize you’re not afraid anymore. You know what you’re looking for. If it doesn’t work out in one instance, it’s okay; you know it will repeat in the future, often multiple times. That’s the proper mindset, though it’s difficult to cultivate in the beginning.
Keep learning with us.
Get new ICT lessons, study notes and updates as we build V2.