
ES Live Commentary AM Opening Session - February 15, 2023
01:54 - How to get an audio check of the session. 07:34 - What makes it more interesting to the downside for foreign currencies. 15:54 - Dollar index and consequent encroachment -.
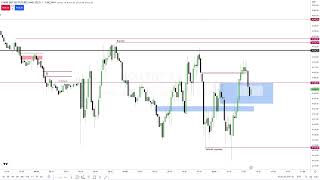
URL: https://www.youtube.com/live/8YSVu51hUWQ?si=2DQ28tkkhAlfttjy Watched Date: February 15, 2023
Outline
01:54 - How to get an audio check of the session.
07:34 - What makes it more interesting to the downside for foreign currencies.
15:54 - Dollar index and consequent encroachment -.
22:30 - What would be the benefit of the market going up to this level here?
28:24 - What to look for in dollar index.
36:53 - Dollar index and fair value gap.
43:02 - S&P is not supporting that move at all in dollar.
47:39 - Why you keep mentioning dollar? -.
53:45 - Kill the individuals that are short and utilize their stop loss.
57:42 - Key turns in the marketplace -.
I'm looking at the dollar index, and we've had a nice run higher. I'm going to favor the sell side on ES early on and watch the opening range.
What that means is in the first 30 minutes, I'm observing how price delivers. I don’t have a fixed bias where I’m committed to taking shorts, but I’m looking for another run through this low, so that we at least know what I’m referring to.
We're looking like we're respecting that order block a little too much here, so it might need to go up a bit higher before moving lower. So watch that order block.
The dollar index would really have to crush that 103.70 level to the downside before I’d get decisively bullish on ES. In simple terms, I believe we’re in a choppy, range-bound condition until that dollar index level is lost.
I’d also want to see that daily candle from January 5th — if we can get through the midpoint (the mean threshold), price delivery becomes more animated and dynamic: faster moves, bigger candles. If the dollar pushes through its mean threshold, we’d expect heavy down-close candles on stock index futures.
As long as we remain below that mean threshold, ES and forex will likely chop around. So watch that blue shaded area on the ES chart — that’s our next premium array, our drawn liquidity.
I’m favoring the likelihood that we’ll probe that low, even though we’ve already dipped below it. Why do I say that’s still on the table?
We already traded through this candle’s close to its low — that’s the consequent encroachment. Extend that level forward, and you’ll see price has already gone down to and through it.
So all this choppiness here may just be a precursor to an eventual run back below that level — whether it rejects there and goes higher later, or continues lower. Either way, I still like the idea of keeping this in focus today.
We’ve identified the likelihood of this being choppy. And you’re also learning how frustrating it can be if you’re fixated on an objective — which is why I told you to sit on your hands.
Choppy conditions make the market very fickle. You’ll see a little bit of movement in your favor, then it retraces deeper than you’d like, then it moves back your way again, making you think it’s about to deliver. Then it pulls back once more, gets close to the level you want, only to fail and wilt.
These are the exact conditions that blew my accounts early on, before I knew how to trade. I’d commit real money here, hold stubbornly to positions, telling myself, “No, this trade is fine, I’m staying in, you won’t shake me out.” But the market would just grind me up.
That’s why you need experience sitting in these conditions — with guidance from someone who can identify them ahead of time. You need to know whether the market is simply going to chop around aimlessly, dangling potential setups in front of newer traders.
💡
Dollar would have to really spread its wings here and push higher for me to feel confident. Otherwise, this run lower on S&P into that sell side we identified might just be them accumulating longs off that liquidity, setting up for a run to the buy side at 4136.50.
The reason you can frame that as a possibility is simple: we’ve had no higher high on Dollar Index. Yes, we ran that ES low and tapped into the liquidity pool we were watching — but in choppy, aimless conditions like today, that very action can be the setup itself.
You want to see it roll right on through the midpoint of that wick — if it’s really going lower, it’ll show you with animation, just rip straight through without showing any respect to the midpoint of that gap or the wick.
💡
When you see conditions like this, it’s very rewarding to know what to expect. If it’s going to be choppy, it saves you all that mental capital chasing big runs that simply aren’t there yet.
Most retail traders? They’ll be all over it, trying to force trades constantly. But wise traders tread carefully here.
I’m willing to let go of the first move of the day when it’s like this. I don’t care. Because in my back pocket, I know that if I’m surprised — if some unforeseen event drops and sparks a big move — I’ll still have the afternoon session to participate in.
That way, I don’t trade out of fear of missing something, or force myself to “understand” what the market is doing right now.
When they’re keeping price trapped in a range like this, it’s basically aimless.
They could run it down into sell-side liquidity, scoop up longs down there, and at the same time use the area above as an offsetting play.
In other words, smart money could be buying into those sell stops, then driving price higher toward the buy-side liquidity. That push upward would serve as the morning move for them.
💡
Another reason we have conditions like this is because the morning move prior to 8:30 and the drive into that lower low represented the real move for the morning. It was clear and easy to see: we broke through the old new week opening gap, created a fair value gap, hit an order block, traded up into it, and then sold off again down into sellside liquidity.
💡
Trend followers often think, “If it goes below that old low, I’ll be a short seller.” That’s typically the retail trader mindset. But if they’re caught short right now, someone has to be on the other side buying those sell stops. In that case, smart money could be accumulating long positions. Where would they want to take price? Likely up toward the morning high and those relative equal highs above. If they bought into the sell stops and there are willing buyers at higher prices, that creates a market efficiency paradigm—smart money accumulates retail shorts as counterparties, then the market reprices to the buy stops, where smart money can distribute and sell into those orders. To confirm this unfolding, you’d want to see a series of large-range close candles. In these situations, no trade means no regret. The benefit of practicing this for months is patience: appreciating that you didn’t rush in when the market wasn’t clean. “Clean” means the moves are clear, well-telegraphed, and obvious in intent. You can only recognize those conditions after sitting through messy, hard-to-read environments like this one.
We now have a lower low in ES, and the same in the Dow, with everything moving lower. At this point, we should see the dollar confirm that move with a higher high, but it hasn’t done so yet. That’s why the dollar keeps coming up—it’s the key to filtering out false breaks. For example, even though ES has made a lower low, this could still be a trap, pulling in traders on the short side just to reverse and run back up to the buy side. So even though NASDAQ, Dow, and ES all agree with lower lows, without the dollar confirming with a higher high, the move risks lacking follow-through.
Symmetry in the market is when everything is in agreement and moving in tandem. In a risk-off scenario, foreign currencies and equities should be moving lower while the dollar moves higher. In a risk-on scenario, the dollar should be making lower lows while forex and equities move higher. That symmetry is what you’re looking for, and it’s a way of constantly measuring market breadth. This is why multiple markets are monitored—intermarket relationships reveal whether risk-on or risk-off is truly in play. If the dollar is rising, it becomes easier to find short setups in index futures and forex. If it’s falling, you look for long opportunities. The key is not to rely on a single market but to build bias and probability by aligning these intermarket conditions.
You know whether to trust or doubt a move by balancing delivery across multiple instruments, not just one. Even if your main focus is the S&P, you compare its behavior with other key markets. If the S&P is signaling one thing but the dollar, forex, or related indices don’t confirm, that’s a sign it might be a false run. The consistency or lack of alignment between these instruments helps you decide whether the move is reliable or likely deceptive.
If the bias had been bullish this morning, with the dollar predisposed to go lower and actually delivering lower prices, then the run below the sell-side liquidity pool would have been a long setup. The entry would come as price swept that low, and an add could be justified if it dipped into the fair value gap. After that, no more adds—just waiting for the move to rip toward 4136. But since those bullish conditions are absent, the approach shifts to observing price delivery in small, incremental pieces rather than committing to the larger bullish scenario.
💡
Even though ES, NASDAQ, and the Dow may have printed lower lows, you can still get sharp moves in the opposite direction. The way to spot those is by referencing the dollar index. When the indices broke lower, the dollar index did not make a corresponding higher high, which you would normally expect. That divergence between them is an SMT signal.
watching a potential BRK+
If we assume buy side is still the target, then after this drop, the focus shifts to where the “damage” was done in the wicks. Down here, sell side was cleared, then price ripped higher, breaking above a short-term high but failing to reach the next major buy side. That buy side remains unfilled, which keeps it a valid target. Retail may see the current drop as a continuation lower, but the more important detail is the candle that broke through — its full range now acts as a bullish breaker. Within that range, you look for inefficiencies like a fair value gap or volume imbalance. The wicks can probe lower, even to the breaker’s low, but ideally the candle bodies hold inside that range and then begin expanding upward. Considering that since 8:30 multiple lows have already been taken and only one buy side has been run, the bias still leans to the upside.
Insanely accurate read on the markets from start to finish by ICT on this episode
AI’s comment:
Yeah, this episode really shows ICT at his sharpest — he mapped out the entire session with precision, from calling the choppiness early on, to showing how intermarket symmetry with the Dollar Index mattered, to framing both the fake-out lows and the eventual buy side run. What makes it stand out is how he didn’t just give levels, but explained the logic step by step — why certain lows were likely to be probed, how breakers and fair value gaps framed the price action, and how patience in chop keeps you from forcing trades. From start to finish, it was a masterclass in reading the tape and market structure.
Keep learning with us.
Get new ICT lessons, study notes and updates as we build V2.