
ES Live Commentary CPI Release - February 14, 2023
03:15 - Today’s Chart:. 08:27 - The 15-minute timeframe. 14:51 - What is the fair value gap? -.
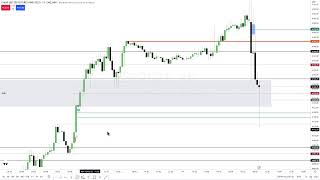
URL: https://www.youtube.com/live/ZdnGlropfmU?si=4ezf0NgelmLSIzd1 Watched Date: February 14, 2023
Outline
03:15 - Today’s Chart:.
08:27 - The 15-minute timeframe.
14:51 - What is the fair value gap? -.
22:10 - What are you looking for in this candle?
30:04 - New Week Opening Gaps.
36:12 - Daily chart of the US Dollar.
41:22 - What’s likely to happen on this day.
49:37 - What’s causing the delay in the market.
54:09 - Smt - Smart Money Tool.
01:00:05 - You’re never wrong when you say, “Try to preserve capital.”.
01:05:59 - How to use this chart to find setups.
01:12:36 - Do we run aggressively into this area?
01:17:36 - How the process framing a narrative leads to a bias for the long side.
01:22:05 - If it accelerates on the downside you want to take a look at the fair value and gap.
01:30:24 - Looking at the first 30 minutes to see if there’s any interest to reprice.
01:36:03 - What’s next for the dollar index?
01:41:53 - You can’t learn it from a book. You have to see it.
We’re in striking distance of the buy-side here. I’m watching to see if price takes that liquidity first, ahead of the CPI release. Then I want to observe whether it rips back down into deeper discounts.
But here’s the point—it’s a gamble. Not worth trading. Events like this are very unforgiving. Most of the time, you’ll see a one-way boom. If you’re wrong, you regret it instantly. If you’re right, you feel like a rockstar. But that’s the trap—it’s not skill, it’s blind guessing.
The market rewards you with excitement but doesn’t build your process. Skill comes from understanding context and probability—not betting on coin-flip moves around news.
I talked yesterday about how, at the start of the morning session, I wanted to see a clear and obvious run on either a premium array or a discount array. I also mentioned before the weekend, on Sunday, that if we opened with a gap higher, I would expect price to trade back down into Friday’s close and then potentially move higher into the imbalances above. On Monday, I pointed out that I liked this particular setup before price traded into it. This marked the new week opening gap for the ES, and as you can see, we’ve already had a strong reaction from the consequent encouragement, the midpoint.
🔥
NWOG
You want to note Friday close and Sunday open prices and then split the range in half—that’s consequent encouragement. It will act as real support and resistance throughout the week. It’s also important to understand that this serves as a tool for identifying whether the market is in a consolidation phase. If price keeps gravitating back to it, you need to adjust your trading to focus on short-term, precise scalps rather than anticipating trending moves. Trending markets tend to move away from this level aggressively and usually do not return to it. We can see that signature here today.
You’re familiar with the low, the high of the inefficiencies. The middle is consequent encouragement, because any gap or inefficiency will have a highly sensitive midpoint.
💡
If you’re bullish, you want to see price avoid returning to that midpoint. Just like when I mention that I prefer fair value gaps to remain unfilled, ideally the market trades back only into the upper portion of the gap when bullish—without needing to touch consequent encouragement. In that case, it’s signaling that it’s extremely bullish.
A macro is a short list of instructions or directives for an algorithm to run, and they tend to repeat. The only time you’ll see them fail is when the market has already moved significantly—either during the middle of the day or right after lunch. At that point, the market has usually completed its liquidity run, and the last hour often becomes listless, choppy, and largely inactive.
That time frame is between 3:15 and 3:45—that’s your final hour macro. As I explained, you’re expecting price to run through buy-side liquidity. Since we’re bullish, it can return to the level I pointed out yesterday morning. Above that rests buy-side liquidity.
Looking at the drop from this high, we apply institutional market structure with liquidity pools. Anchoring from the short-term high before the retracement gives us the standard deviation levels. The target is the buy-side resting above, specifically 4150 even.
By 4:00 PM (the 16:00 candle), positions should be squared. The high of that candle reached 4150.25—one tick above. As I mentioned over the weekend, the market often removes those “mohawks,” ensuring seamless delivery by pushing just beyond the obvious tick. This happens because of the bid-ask spread, the same nuance that caught me last week when I tried to finesse an exit.
💡
One standard deviation we can use comes from the first retracement against the overall direction after the market structure shift. In this example, the market shifts bullish, then retraces lower into the dealing range before expanding higher. That retracement, measured from low to high, can be projected forward with multipliers to define expansion targets. You have to pair that with narrative and align it with liquidity.
You can be both buying and selling within the same day. One trader might operate mainly in a single direction within a daily bias, but you can also trade without a bias if you understand what liquidity is likely to provide as the net draw.
New week opening gaps and new day opening gaps are true fair value levels. They act as real points of interest that the market naturally gravitates back to. The market is coded to do this because it creates sentiment and provides incentive for large funds to bring orders into the marketplace, which ultimately drives price toward liquidity.
New week opening gaps are especially important fair value levels, and you should always have the last four marked on your chart for completeness and clarity.
You need to remember that the market operates with only two primary functions: running to liquidity and filling inefficiencies. That’s it—nothing else matters, except how these functions align with time.
Six minutes after the CPI release, we took buy-side liquidity, then pulled back slightly, while still leaving another buy-side pool above. ICT notes: “For me to turn bullish here, I need to see a meaningful move above the m1 PWCE. (Premium Wick Consequent Encouragement)”
💡
On a day like this, you want to watch the period between the 8:30 CPI release and the 9:30 market open, and then see how they use the opening range once the bell rings at 9:30 New York time.
It would need to go above the consequent encouragement for me to be bullish, and it would need to do so with speed, distance, and time. The 9:30 opening bell hasn't run yet, so this is all pre-session narrative building. Just because you're on the chart doesn't mean it's time to enter.
As a younger trader, when I first discovered that Non-Farm Payrolls repeated every month, I couldn’t wait to trade them. The volatility these events bring creates a lot of price movement, and you start thinking, “This is the day I want to trade.” But the truth is, most other days are safer for trading. Non-Farm Payroll days are the ones most likely to hurt you, and because they move so much, it’s easy to get caught and take losses quickly.
💡
Higher dollar is risk off, that means it's easier for equities and foreign currencies to drop. I’m measuring risk-on and risk-off across a wide array of instruments. I use the bond market—looking at the 5-year, 10-year, and 30-year yields—for divergences to confirm or negate price moves in the ES. For forex, I seek confirmation that what I’m seeing aligns with bond yield movements. You can refer to my core content to understand this approach in more detail.
Watch this gap closely. If price moves above it and it holds as support, we’ll observe whether it can push back up toward the CPI high.
Also note the REQLs on ES inside NWOG C.E.
NQ
YM
My focus on ES is this gap. I’m watching to see if price moves above it, holds as support, and then tries to run back up to the 4170.25 level, or if it fails to get through and moves lower. Either way, this initial FVG is likely to influence the first part of the morning.
If price trades down to the IFVG high and I’m bullish, I would enter at that high. If it moves down to the midpoint between the consequent encouragement (the upper quadrant 0.25), I would also use that as an entry. My stop loss would be below the swing low outside the IFVG. Once price reaches the lower quadrant (0.75) of IFVG, I would exit the trade without second-guessing, because following my rules and processes indicates it’s not favorable to hold. You need clear rules of engagement: know what you’re looking for, what you don’t want to see, and understand them thoroughly. With experience, you’ll trust the process and recognize when exiting is better, without worrying about missing out. You’re never wrong when preserving capital.
💡
You can have the nicest sports car or the most luxurious vehicle money can buy, but if there’s no gas in the tank, you’re not going anywhere. You’re just sitting on the side of the road, and no one cares. Similarly, if you don’t have equity in your account, you can’t trade. Your number one rule is to preserve capital—not to multiply it as fast as possible or push maximum leverage in a funded or real account.
This small gap here has been repriced (blue shaded). The question is: do we trade below it for sell-side liquidity, or do we move above it and treat it as support? If price initially trades above it and then comes back down, this would be considered a reclaimed fair value gap—similar to how broken resistance often turns into support.
Imbalances are the differences between the low of one candle and the high of another with one pass through. This small pass-through (blue shaded) creates an imbalance that needs to be delivered on the upside, which we observe as price moves back up through it.
Above this SIBI (marked with red lines) , there are no imbalances, which implies that if the market rallies and finds support here, it’s likely to reach the rejection block—the highest closing price. The consequent encouragement from the wick here toward a new high, frames the buy-side scenario.
When you're watching price like this, it frees you from the need to be right or wrong. Unfortunately, many traders try to force themselves into that laboratory experiment using a demo account—or worse, with real money or a funded account—only to discover that they don’t yet know how to trade. They struggle to manage themselves, act recklessly, are impatient, and make impulsive decisions. It’s like getting drunk and getting behind the wheel: nobody in their right mind would do that, yet that’s exactly what you’re doing when you risk live money just to “see what happens,” hoping you might make it through unscathed.
From that 4146 to the consequent encouragement at 4140.25, that’s five handles. For a new student trying to find something that repeats—a little cookie-cutter setup, a first “trophy” or reward while studying price action—this is exactly what I teach them to look for. These setups are easy to spot throughout the day, especially when the markets are more likely to move one-sided.
That low within the previous new week opening gap—if we break below it, then as long as we remain under the consequent encouragement level, the day is bearish. For me to even consider probing the long side, price would need to get back above the high of the previous new week open, specifically 4146. This demonstrates how I frame a narrative, which establishes a session bias. Everything has a reason, a place, and a logic behind it—it’s not contrived, conjecture, or cherry-picked. It’s a simple process of evaluating what is most favorable versus what is unlikely. At first, the number of considerations can feel overwhelming, which is why guidance from someone experienced for a year can be invaluable.
Any imbalance here? No. So which level am I focused on? I’m looking at the difference between the midpoint and the low of the new week opening gap—these two levels. I split that in half, often rounding, which is why you sometimes see me using partials.
Do we accelerate to the downside? Everything remains bearish until we get above 4146. This may feel like extra detail, but you’ll grow into it. The strongest technical analysis considers intermarket relationships. Trading solely from the chart you’re looking at is like standing with your nose against a tree, trying to see the forest—you won’t see the whole picture, and it can be very frustrating if you just want it to be easy.
I realized that you have to constantly monitor other factors, as they all influence your trading—everything is connected. Earlier, I mentioned looking at the bond market. Why? Because interest rates are the fundamental driver. Long-term macro influences in the marketplace are primarily driven by interest rates, whether you’re trading currencies or equities. Interest rates dictate commerce—how money is lent and borrowed. The ease or cost of access affects all areas of commerce. Since we trade forex and equities, it’s essential to keep a finger on the pulse and understand what interest rates are doing.
💡
We’re trading at a discount relative to yesterday’s close. The retail trader sees a gap lower from where we closed yesterday to where we are now. Because of that, there’s a likelihood the market will pull up and gravitate toward that level—not always immediately, but it’s something to measure once the market starts trading at 9:30.
The opening range is traditionally from 9:30 to about 10:00, roughly 30 minutes. During that time, I measure the willingness for price to move back toward the previous session’s close. If there’s a gap down, I watch the first 30 minutes to see if there’s any interest in repricing back to that level. If there’s no immediate push, it indicates extreme bearishness. Then I turn attention to deeper discount objectives on the 15-minute, hourly, or daily timeframe and use those to frame a bias.
With electronic trading, algorithms often drive this repricing back to fair value. Think of it as support-turned-resistance: if the market fails to attempt a move up, it signals underlying weakness and potential for further decline. In that case, we expect price to move through the midpoint or the consequent correction of the previous day’s fair value gap. If it trades below that level with speed, we anticipate further downward movement. The first few minutes after the 9:30 New York open are crucial to determine whether the market intends to retrace.
m15 IFVG low is reached - he suggested a screenshot here
Hopefully this helps. I know it would have helped me as a trader when I was first starting out. Having this information and the logic—knowing what to look for, what levels are key, what you’d expect price to do around these levels, and what factors constitute a sustained price run higher or lower—is critical.
This is what I’m teaching you, but you can’t learn it from a book or by watching videos. You have to see it applied daily, day in and day out, using the same logic consistently. Through repetition, you begin to see when it really works and when, as the operator, I make mistakes. That experience should encourage you not to fear making mistakes as a trader as well—because it will happen. Everyone is human.
it has closed m15 imbalance by repricing down into m15 BISI Low
Keep learning with us.
Get new ICT lessons, study notes and updates as we build V2.