
ES Opening Session Commentary - February 21, 2023
00:36 - Good morning folks. 01:55 - Why you have to be cautious this morning -. 07:48 - What you need to know about today’s session.
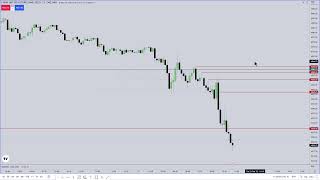
URL: https://www.youtube.com/live/8eLTttpPN2I?si=VNtP5yAPH6iaZMzn Watched Date: February 21, 2023
Overview
00:36 - Good morning folks.
01:55 - Why you have to be cautious this morning -.
07:48 - What you need to know about today’s session.
14:50 - Buyside resting at 4073.
19:43 - How much of a price move transpires between the point at which we draw attention to it and if it goes to a level that we were expecting
24:58 - candles on the chart.
27:00 - Down Close Candle -.
31:34 - Dow, S&P, and Nasdaq in tandem.
37:07 - Nasdaq has a small fear of a gap -.
41:57 - Dow, S&P, and Nasdaq make lower lows as soon as they traded up.
49:29 - S&P has hit a new lower low on S&P.
52:58 - The importance of experience in learning to trade.
57:58 - Stop letting other people influence you to tell you how to teach.
01:04:13 - What is the New Week Opening Gap?
01:09:31 - How do you know when it’s going to be a trending model.
01:14:04 - What happens if the market runs away from the 4050 level?
01:17:08 - How the market is going to gyrate.
01:22:45 - The most important thing you need to know about the market.
01:30:58 - Nobody ever becomes consistently profitable independently wealthy and living off their trading by doing that.
01:37:40 - How do you know what you’re looking for?
01:44:57 - When you lose your invincibility, that’s when the ghost of the ghost is on.
01:47:33 - What happens when the price of a stock goes above the old high.
01:53:37 - How to use price charts to understand the market.
01:59:10 - The importance of expecting difficult sessions -.
02:03:52 - What’s not in the chart.
02:12:00 - High resistance liquidity runs have more likelihood of short-term stops being rated.
I’m going to give you the reasons we need to be cautious this morning. A holiday this week disrupted the normal ebb and flow of price, sentiment, speculation, and order entry. Many traders, like me, sit out on those shortened sessions—trading from 9:30 to noon doesn’t provide enough time for meaningful movement. It’s important not to feel pressured to participate in that. Anytime a holiday impacts normal trading hours, the very next session carries very low probability. The morning can be choppy or even a complete wash—no clean entries, nothing technically sound to engage in. But it’s still valuable for you to observe it.
He’s explaining that if the morning looks like it’ll be choppy, low-liquidity, and aimless, he prefers to take a trade earlier in pre-market (7:00–8:30).
That way:
- He avoids being forced to take risky trades at the 9:30 open.
- He sidesteps unsafe conditions when the market doesn’t show clean, favorable setups.
- The lesson is not just spotting order blocks or fair value gaps, but also knowing when not to trade.
In short: if the environment isn’t safe, wait or use the pre-market window instead of forcing trades.
I’m going to quickly explain why this is the case. This is why I warned you in advance that we’re likely facing a very difficult morning session. If you look at the dollar index today, it’s all over the place—choppy and range-bound. On the 15-minute timeframe, it’s clear there’s no real direction. Add to that the fact we’re coming right off a holiday, and the ES lacks clarity about what it’s reaching for.
The opening range, the first 30 minutes from 9:30 to 10:00, is a time to observe—not to act on impulse or chase moves, even if price begins to run without you. In these conditions, the moves are basically 50/50, unpredictable. You want to reserve your trading for environments that are clearly favorable, where low-resistance liquidity run signatures are present. This morning, we don’t have that. But it’s valuable for you to learn to recognize and respect it.
Because this market can turn choppy, we can fall into what’s called seek and destroy. Many times it starts off looking like a clean price run is about to unfold, but then it flips—either trapping you if you engage too early or leaving you stuck waiting for another setup.
Right now, conditions lean that way because we just came off a holiday with an abbreviated Monday session. That affects sentiment, order flow, and participation. There isn’t much interest at the moment—most traders are on the sidelines, waiting to see what the market wants to reveal.
The main takeaway right now is that we’ve already identified this morning as difficult, and it’s playing out that way. On the upside, leadership has been with the NASDAQ, which just tapped a liquidity pool. Now we’ll watch to see if the ES tries to catch up.
Across forex, there’s no clear confirmation of risk-on or risk-off—euro and cable against the dollar are still flat. That makes trading the non-dollar crosses, like euro-pound or aussie-yen, more attractive in conditions like this since they’re more likely to move.
We outlined the 9:31 down-close candle. I wanted to see price support that move by trading down into it without piercing through. It held, then the following candle tagged the mean threshold—the midpoint of that down-close candle, forming an order block. From there, price repriced higher, and the next candle opened and traded back down into a volume imbalance and order block.
You want to be looking at other markets for confirmation, not just one timeframe on one asset. Even if you specialize in the ES, broader context matters. On a holiday week, price action usually won’t be clean. The market can form a seek-and-destroy profile, sweeping every short-term high and low back and forth without real direction, sometimes all the way into lunch. But with a large opening gap lower, we’re opening at a discount—meaning price is below the prior session’s close. In those conditions, the market often probes higher first, even if it ultimately intends to go lower. It does this to pressure shorts, run their stops, and then accumulate for a potential move down. That’s why I pointed out buyside liquidity pools before the open, even though conditions remain problematic.
ES, NQ, and Dow should move in tandem—clean price runs, all stepping higher together or lower together. That’s the sign of alignment and favorable conditions. But when that’s not happening, when you don’t see them lockstep, it confirms exactly what we expected: a problematic session. That confirmation alone is worth its weight in gold.
NQ chart
DOW
ES
You’re gonna look down here—that’s where the liquidity sits. All the retail traders who chased this run left their stop losses just below that low. Those stops are sell stops. Why does smart money drive it down there? Because earlier, they sold short into the buy stops resting above the old high. That’s offset distribution: shorting above an old high, harvesting buy stops, then waiting for price to reprice lower. The market moves below that old support level to trigger the sell stops. This lets them short into buy stops and then buy into sell stops. That’s the market efficiency paradigm I teach in the core content.
Lower low on Dow and ES and failure to go lower on NQ.
NASDAQ is a wild beast—it exaggerates its moves. If you’re wrong and end up offside, it can smash you quickly. The ES, on the other hand, is a bit tamer and trades more professionally. That doesn’t mean you can’t trade the NQ, but you have to respect its volatility.
DXY - yet to make another higher high
While watching price action this morning, if the dollar index makes a higher high and we don’t see an abrupt reversal on the NASDAQ—that’s the one to watch right now because of the SMT divergence—then pay attention. Between the Dow, S&P, and NASDAQ, all should have made lower lows, but the NASDAQ hasn’t. That could signal an intermediate-term low in the morning session, leading to a push higher toward buyside liquidity and the overnight range between yesterday’s close and today’s 9:30 open.
However, if the dollar makes that higher high and the NASDAQ fails to sustain a move above 12,275, then the Dow and S&P making lower lows adds pressure for the NASDAQ to also post a lower low. That’s how intermarket relationships help us read and weigh moves—you can’t rely on one instrument alone. Doing so is like trading with one eye closed, and that’s not an advantage.
Let’s say, for the sake of discussion, we weren’t coming off a holiday. The Dow made lower lows, the S&P made lower lows, and as soon as price traded up into that fair value gap right there, I would’ve treated it as a short opportunity to target this level. I’m not trading NASDAQ here, and I’m not encouraging anyone to push buttons, but the logic is clear.
👉
Because we’re still inside the opening range, with two minutes left in the first 30 minutes, that window matters. Once the first 30 minutes are complete, you shift to identifying your 15-, 5-, and 1-minute buy-side and sell-side liquidity pools, along with inefficiencies. That becomes your framework from 10:00 until noon. Every day, it’s the same process—using that first 30 minutes to map out the lay of the land. From there, setups unfold through repricing to premiums or discounts, stop runs, or inefficiency fills.
that's the setup to case those of you who want to do the NQ instead of ES. You had another live example here.
Now we’ve got alignment: the Dow, NASDAQ, and ES have all made lower lows. With that condition met, the next step is to check the final qualifier for bias—the Dollar Index.
Has the dollar made its higher high? Not yet. But since all three equity averages have already printed lower lows, the expectation is for the dollar to push up and pierce that 104.26 level. If it does, that should translate into further weakness in EUR/USD and GBP/USD, sending both euro and cable lower.
Intermarket and intramarket analysis is all about understanding correlations—whether assets move together or in opposite directions. The dollar typically moves inversely to forex majors and equities. A rising dollar signals risk-off, often leading to shorts forming in index futures and forex pairs.
We’ve already met the condition of lower lows across all three averages—Dow, S&P, and NASDAQ. Yet, the Dollar Index has not confirmed with a higher high. That creates an SMT divergence. Because the dollar hasn’t validated strength, those fresh lows in ES, NASDAQ, and Dow may actually be setting up as intermediate-term lows.
4029.50 Make sure you have that on your chart for ES. That's the next sellside liquidity pool that I'm interested in.
You don't see me doing it, but I'm audibly walking you through it. I have all these monitors in front of me and I'm constantly toggling my attention through them. I run a matrix of one-, two-, three- and four-minute charts on the NASDAQ, and the same setup for the E-mini S&P. I scan that content for micro gaps and inefficiencies, while monitoring the relationships between markets — NASDAQ vs. S&P, and the Dow (which is the leader to the downside today).
I'm also watching the dollar index. I move my attention across all the screens so I'm taking in information from every instrument, not staring at one tree and pretending I'm seeing the forest. This panoramic view lets me accumulate a collective read across the entire marketplace.
Now, because my focus is on the lows, I’ve toggled the price source setting to low. That way, if the ES makes a lower low but the NASDAQ doesn’t, that immediately signals an SMT divergence. If that divergence confirms, that’s when I’ll step in. For now, it’s just observation — letting the market show its hand before committing.
You can’t overstate the necessity of experience—being in these moments countless times before, learning not to let emotions dictate reactions. I’ve said already this morning would be challenging, and it has been. Plenty of movement, but not a clean price run day. Once we reached the buy side, I warned it could turn into a seek-and-destroy profile, and that’s exactly how it’s developed.
Cynics want trading to be binary—buy or sell, right or wrong—but that mindset misses the real benefit: objectively reading price action without emotional weight. I don’t benefit if I’m right, and I don’t suffer if I’m wrong, which is the exact mindset a student must cultivate. When you learn to read price without attaching profit or loss, you’re in the sweet spot of learning.
No educator emphasizes this stage—most rush students through patterns, sample sets, or backtests. But 20 trades, three months, six months of backtesting doesn’t prepare you. It only prepares you to gamble. What I’m pushing you to see is the importance of slowing down, observing, and embracing this stage for what it is—where the real growth happens.
The idea of watching price, taking in the information, and weighing the effects and confirmations you expect to see in other markets — Dow, NASDAQ, etc. — is what builds conviction. What feels fearful now is simply a lack of experience. By running safe, controlled “laboratory” experiments — observing price action without risking capital (not even pressing a demo button) — you learn to trust the tape. No book or trading course provides that; this is what the mentorship delivers.
There are many ways to reach profitability, but you cannot rush proper learning. If your goal is to read price action and interpret intraday fluctuations for day trading or short-term trades, those same skills can also apply to swing and long-term positions. That’s why I teach on lower timeframes — they’re dynamic, give instant feedback, and allow multiple setups in a short window. At first, you won’t see them because you lack experience, but once you do, no one can take it away from you. Losses will happen; they don’t mean the methodology is broken — only that you as the operator made an error. Responsibility is key: own your stops, own your choices. Too many traders want wins credited to them but losses blamed on others — that’s an infancy mindset. You must taste both the sugar and the vinegar. This approach has worked for decades and won’t suddenly stop working. You’ll continue to encounter repeating patterns, alongside new tools like the new week opening gap. But don’t abandon what you already know for new toys. The opening gap is just one cog in a bigger machine, a fair value reference that algorithms respect across Forex, futures, and even equities like SPY or QQQ. Key levels — the high, the low, and the midpoint (consequent encroachment) — guide how price reacts. Combined with understanding inefficiencies and wicks as algorithmic gaps, these tools help you trust the market profile you’re in.
Coming off a holiday session changes the rhythm of the market. Yesterday ran from 9:30 to noon, not a full day, and trading in such truncated hours makes price delivery forced and unnatural. I don’t like to demand movement from such a short window — it’s better to let the market settle back into its normal state, just like after Christmas break. There’s no rush, except for retail traders who can’t wait to jump back in the first minute after a holiday. But those conditions usually breed difficulty the next morning session: price can turn fickle, choppy, prone to “seek and destroy” — piercing short-term highs and lows without real follow-through. It didn’t unfold that way today, but it could have, and seeing that would have been just as valuable. Instead, we watched price push to the buy side, I warned it could turn into seek and destroy, then pointed to the sell stops. It did break lower, with NASDAQ first holding strength, running to its liquidity, but then giving way, falling in line with ES and the Dow.
Because ES was unable to sustain a move higher after taking buy-side liquidity, and instead broke down from SIBI, market has shifted into a trending model lower. The key reason:
- We are too far away from the new week opening gap (Friday’s close vs. Sunday’s open).
- When price is distant from that reference point, the algorithm has no interest in retracing all the way back up to it.
- Instead, it respects that separation as confirmation of directional bias — in this case, lower.
So, when weighing out market conditions, the distance from the new week opening gap is a contextual filter:
- Near it → the gap often acts like a magnet, pulling price back.
- Far from it → the gap loses influence, and trending conditions (continuation away from it) dominate.
- Consolidation / Range-Bound
- Price repeatedly returns to and hovers near the New Week Opening Gap (NWOG).
- This proximity means the algorithm is balancing, not running away.
- Expect: choppiness, liquidity sweeps, mean reversion behavior.
- Trending
- Price stages a run away from the NWOG, and we are not coming off a holiday session.
- The greater the distance it establishes, the less likely it is to revisit.
- Expect: continuation in one direction, with retracements as setups rather than reversals.
That’s the schematic:
- Near NWOG → consolidation.
- Far from NWOG (and not holiday conditions) → trending model.
Now, when he asks: “What’s the expansion here on the downside?”
He’s pointing to the process of identifying where the market is likely to extend:
- Once trending lower is confirmed, expansion targets are typically sell-side liquidity pools: equal lows, obvious swing lows, imbalance fills, daily lows, etc.
👉 So the roadmap is:
- Check relationship to NWOG.
- Decide: trend vs. consolidation.
- If trend → measure expansion in that direction using liquidity/reference points.
A schematic, a roadmap, a way of expecting price to deliver a very generic procedure or process. If it's going to be trending, if there's going to be a condition of market trending, not just consolidation, a choppy range bound consolidation. Range bound consolidations are expected and confirmed when price continuously stays real close and returns back frequently to the new week opening gap. If the market can stage a run away from that new week opening gap, and we're not on the heels of a holiday setting, expect trending. How do you know when it's going to be a trending model and when it's going to be consolidation? If we're going to be in range bound consistent conditions, it's important to know what tools we refer to, that way it helps you, it keeps you founded on sound logic and not chasing every minor little fluctuation in price action. There's rules, there's processes, there's things that we have to use for filtering. You thought it was to simply go in here and look for an order block or a fair value gap and you're going to be rich. No. There's no five minute learn ICT trainer that's going to give you consistency. They might introduce the concept in a very abbreviated fashion for clicks and views on their YouTube channel, but they're not going to dig into what's needed for you to be successful with what I've adopted, created, and authored. You can't shortcut this stuff. There is a right way of doing it. What's the expansion here on the downside?
okay you want to screenshot your ES chart
It's important to calm yourself and not get carried away. There’s a lot to learn, so let’s start with this year.
I just want to see it pierce the 4029.50 level a bit more meaningfully. Then I’ll review everything we covered this morning and give you the takeaway so you can add it to your journal.
If it runs away from the 4029.50 low, I would treat that as a tentative afternoon move because liquidity hasn’t really been cleared below it.
You’re probably wondering where the 4029.50 level comes from. If you pull up your regular trading hours—on your ES chart, toggle the lower right-hand corner to “regular trading hours”—you’ll see it within that timeframe.
That’s the low right here, January 30th, Monday, at 15:45, marked by the candle time at the bottom of the chart. That’s the level we want to see pierced through.
👉
It’s so easy once you know what you’re supposed to be doing, but so hard to stay disciplined and go through the process of finding yourself in all of this.
I gave you a filter: as long as we remain below 4049, we would see 4029.50. Why? Because there’s liquidity drawn to that low—it’s a higher timeframe reference point. Large funds have their orders resting there.
Let me put it another way so it doesn’t sound harsh. When you set your stop loss and price hits it, the market doesn’t see your stop loss. You’re not trading in a size that even registers as significant. The market moves to these levels repeatedly to trigger or purge actual institutional orders.
In simple terms, it runs above old highs to trigger buy stops. Those buy stops might be resting above the old high to protect a short position, or they might be entries for new longs, viewing the break higher as a catalyst to get in.
The same applies in reverse below old lows. Sell stops below those lows might be short entries on a breakout to the downside—selling weakness—or protection for a long position.
We don’t care which. You can read the chart and see whether price action is mainly clearing out longs or establishing a new breakout to the downside.
For instance, what kind of buy stops would be resting above this high? They’re protecting short positions, because the market has already moved down. It’s not rocket science—it’s simple. Above that old high is a buy-side liquidity pool, mainly serving the purpose of protecting shorts.
You have these little epiphanies, those “aha” moments where it all seems to click. But what you’re really telling yourself is that you’re ready to start trading live—before you actually should. I know what you’re doing; it’s the same thing everyone does. You don’t want to pay for those painful lessons and collect scar tissue. But skipping that will only slow down your learning. If you want to learn the fastest way, follow everything I’m telling you to do this year.
There are so many variables, and each one opens the opportunity for you to develop your own personal approach to using it—that’s how it’s done correctly.
You need to put your face in front of these charts and listen as I explain each individual candle, walking you through the logic of why the market shouldn’t be doing this, why it shouldn’t be doing that, and where it should be going. That’s what you really need. It’s not the entry, not the order block, not the fair value gap—you’re stressing over those things when they’re the least important part.
By watching real-time price action like this, you’ll start to see your setup—your eyes will catch it, and it’ll make perfect sense. Even if I don’t like that particular PD Array or specific element and don’t mention it at the time, you’ll still recognize it and trust it, because you hear me saying: it’s going to go down to 4029.50, it should stay bearish, and as long as it remains below 4049.
From there, you start looking at consequent encouragement of fair value gaps, bearish order blocks, optimal trade entries, institutional order flow entry drills, whatever it is you trust. And because you’re listening to me, with three decades of experience, you know I’m not just rolling dice or throwing mud at the wall hoping something sticks. I’m telling you where the market is going, what it will gravitate toward, and what it shouldn’t do.
But the folks who have gone through my content—they know what a breaker is, they know what a fair value gap is, they know institutional order flow entry drills, they know consequent encouragement. They know all these things. They just don’t know when to use them, because they don’t know how to determine bias. They don’t know how to determine direction.
If they could simply figure out where the market is going next, they could easily pick the setups they want to trade. But they don’t want to do what I’m making you do with me live: observe price action with no monetary reward and no risk of loss. They don’t want to commit to that. Their fear is that if they spend the time doing all this and still can’t succeed, then it will feel like a waste.
But when I say it’s a waste, I mean that not doing this is the waste. You’re cheating yourself out of the real learning experience that’s available to you—for free. All you have to do is show up every day. You’ll learn bias, you’ll learn true market profiles, you’ll learn how to determine schematics in real time before price delivers. And you don’t have to be emotional or afraid.
I may sound more animated now because I’m trying to convince you to just keep showing up. You’ll see the evidence, you’ll see the proof. Nothing here is contrived, nothing is conjecture. It’s science—it’s all coded. But you must wait for these things to unfold before you can determine, with high probability, what the market is going to do.
That impatience you feel right now—it’s insatiable, because you’re in a rush to make money. That’s understandable. But you have to squash it. You have to work hard to resist it. Because there’s no limit to what you can earn, but there is a limit to how much you can lose—everything you’ve got.
And yet, you’re in a hurry to push that limit, to overleverage whatever you have—whether it’s a funded account or your own money. If you trade prematurely through ignorance, it will be emotionally and psychologically debilitating.
If that happens, you won’t want to come back to these live sessions. You’ll become toxic, second-guessing everything I say, looking for reasons to blame me so you can justify your losses. But the truth is, I’ve been telling you all along: don’t trade with real money yet. Learn first. Do this properly, and you’ll be able to read the candlesticks before they even print. But you cannot do that if you’re consumed with worrying about the outcome of your trades.
If you made money this morning based on what I said in these live streams, you didn’t actually learn anything. You’ve done yourself a disservice by weighing the experience only in terms of whether you made money.
You might feel good, confident, even empowered—but that is not the real lesson. You have to be indifferent and completely detached from the outcome, whether it is monetarily rewarding or painful through a loss. That’s the only way to truly uncover what you’re looking for, because it won’t come from being motivated by money.
Candlesticks will keep repeating the same patterns all year long. But you won’t gain the benefit of knowing the best approach for you as a trader if you focus only on outcomes. Breakers are not for everyone. A Fair Value Gap is not for everyone. I’m a realist—I know that. What I’m trying to be is a voice of reason, so you can approach this the right way and not waste your time.
Studying is never a waste of time. Think about surgeons: do you believe they watched a five-minute video on brain surgery and were then ready to operate on your loved one? Of course not. They studied, practiced, and organized their knowledge with patience. Trading requires the same commitment—you can’t just roll the dice.
I tweeted the other day: many of you rush into trading real money too soon. Most people skip over this part of the lesson because they don’t want to hear it, but this is exactly why they fail.
If you’re rushing to trade your live account or funded account, acting impulsively, pushing buttons because you think you see something—hoping for 5 handles, 20 handles, or maybe just $200—you are sabotaging yourself. You might catch a small move, but instead of taking profit, you fall in love with the trade. Then it reverses, takes you out, or worse, you don’t have a stop loss and it rips against you.
What follows is regret—because deep down you knew there was no reason to enter that trade. You just wanted a distraction from a mundane existence. I was like that too. But nobody ever becomes consistently profitable or financially independent by trading this way. That approach never leads to consistency. The only thing consistent about it is losing and regretting.
The right way is to sit back, observe, treat each session like a laboratory experiment, and understand that the outcome is knowledge: knowing what you’re truly looking for in price.
Core Lesson: Detach from monetary outcomes. Consistency comes from observation, patience, and structured study—not impulsive live trading.
I mentioned that we would likely draw up here. It’s beneficial for price to move up into this buy-side liquidity.
Why? Because buy-side would be accumulated as shorts by smart money—and then they would let it ride.
Core Lesson: Price seeks buy-side liquidity, where smart money uses it to build short positions before driving the market lower.
I walked through the filtering process, using other market instruments to justify or negate an idea. If the things we were looking for fail, then the opposite is true—and that’s how you refine your trading.
Core Lesson: Use correlated instruments to confirm or reject trade ideas. If the expected conditions fail, assume the opposite and adapt.
Dow - YM
NQ
ES
DXY
The Dow has come off its lows, while the NASDAQ is still close to its lows, and the ES made a lower low. The Dollar Index has slipped lower as well. On the 15-minute reference point, it failed to make a higher high.
So what does this indicate? If the dollar is not rallying but instead dropping lower, while EUR and GBP are rising, that suggests a potential risk-on environment. In that case, we want to see the lows in the indices respected and look for a bullish shift in market structure while this condition is in play. However, if we take out the high, that changes the outlook.
This is how I frame what I’m looking to do in the afternoon: I analyze the relationships between markets through the lens of risk-on and risk-off conditions. Since the dollar failed to make that higher high and slipped lower, notice also what’s happening: the dollar dropped into a higher-timeframe pool of liquidity.
If the dollar continues to drop, stays soft, and remains heavy (meaning likely to keep moving lower), we monitor that throughout the day with the Dollar Index (DXY). If that occurs, we constantly watch the averages of the ES, NASDAQ, and Dow. If, at any point intraday, there’s a bullish shift in market structure, that could be a catalyst for a deeper retracement. But if the Dollar Index consolidates and holds inside its low, the conditions may remain uncertain.
Core Lesson: Use intermarket analysis—especially the Dollar Index versus EUR/GBP and the equity indices—to gauge risk-on/risk-off conditions. Watch for bullish market structure shifts in indices when the dollar weakens.
As long as we are inside that low here—just bouncing around in consolidation—the NASDAQ, S&P, and Dow could still move lower. But if we break below these lows and the dollar gets very animated to the downside, it sets up an interesting afternoon for trading long. That’s what I would like to see, but I have to wait and see what the market gives at that time.
I wouldn’t consider anything until 1:30. That’s usually when I sit down and review the charts. Between 1:30 and 2:30, I typically form a clear idea of what I’m looking at to engage—not always, but usually by then.
Core Lesson: Consolidation in the Dollar Index allows indices to drift lower, but a sharp break below lows in the dollar can set up long opportunities. Best setups often form in the afternoon review window (1:30–2:30).
By watching price action every day and reading it, you’ll eventually know what it is you’re looking for. Right now, you don’t know—you don’t know what your setups will be. You may enter the market expecting a particular scenario, and then price completely negates that idea.
What do you do as a trader in that moment? Do you lose your mind and say, “That’s it, I can’t trade, this stuff doesn’t work”? Or do you stop, reevaluate, and see what’s really happening? You’ll realize what you expected initially is not in alignment with what the market is doing now—so you must adapt. Or, you sit on your hands, with no regret or impatience, and wait.
The truth is, 90% of you don’t have that discipline yet. And that’s not a knock—I didn’t have it either. It was forged through losing real money and realizing I had to slow down, give myself permission, and allow myself the time to learn.
It will be a different experience for each of you.
Core Lesson: Consistent trading requires adaptability and patience. If price negates your setup, either adjust or do nothing. Discipline is built over time, often through hard lessons.
These price points will be delivered because the algorithm is coded to reprice into liquidity. It does not know how many contracts are resting there—how many buyers sit above an old high or how many sellers sit below an old low. It doesn’t need to know; it only needs to reprice to or through those levels. Traders who understand liquidity become the counterparties at that moment. As soon as price moves above an old high, the buy stops are triggered and become market orders to buy. You only have a brief window before price reprices away, higher or lower. The surge above the high turns those buy stops into market orders and floods the market with willing buyers at higher prices.
That’s advantageous, because if the Composite Man expects price to reprice lower toward the sell-side, he wants to be at the charts when price reaches that level, with orders ready. He places sell limits into that pool of buy-stop liquidity—or engages live as price runs above the old high. Those buy stops create a flood of willing buyers at higher prices. If you can pair off as the counterparty—short into those buy stops, like the Composite Man—you can then sit back and wait for new opportunities as price works toward the discount level at 4029.50 and the liquidity resting below it.
They don’t panic every time it rallies. They’re not thinking about harmonic patterns or trendline mythology. There are no wave counts to obsess over and no diagonal lines that must be perfectly drawn. The mission requires time—you have to give it time. At 11 o’clock (London close in FX), the Composite Men in that time zone are closing up; then it’s just New York. We often see range-bound consolidation and retracements through the lunch hour. The market doesn’t “take lunch,” but the algorithm allows for that behavior. Lunch can produce a consolidation that continues after lunch, or it can consolidate and book the day, or it can consolidate and then retrace.
Remember where we are relative to the New Week Opening Gap (Sunday’s open vs. Friday’s close). The market delivered to the sell-side we anticipated—but it wasn’t a clean run. It was lots of give-and-take. This is a High-Resistance Liquidity Run: even though it reached the sell-side liquidity pool and the discount level at 4029.50, it did so with repeated, deeper retracements.
What we want are those “one-way rail” moves—no time wasted, you’re in and it rockets to the objective. People will say you can’t time the market. That’s nonsense—pure Grade A nonsense. They can’t do it; they haven’t been trained. When you finally see it and taste it, it’s different—empowering, encouraging. It strips away ambiguous distractions and forces you to respect time.
If you’re trading the morning session and expect a draw on liquidity (or a move to discount after buy-side is taken), understand that after the holidays the market can enter a seek-and-destroy mode. Our attention then shifts to sell-side, and we watch other markets to confirm the eventual breakdown. But don’t assume a straight line. It will retrace—more than you want—because it’s high resistance. Not “resistance” as in “won’t go higher,” but high resistance as in: it can go lower, yet it will be met by deeper, repeated retracements on the way.
Core Lesson: Price is algorithmically delivered to liquidity. Buy stops above highs become market buy orders—prime fuel for smart shorts. Expect time-of-day behavior (London close, lunch consolidation) and recognize High-Resistance Liquidity Runs: the draw can still complete, but with frequent deep retracements.
All through here, this completely upsets traders who think they want to be short—they get knocked out. When that happens, the buy-side liquidity pool we outlined is triggered. This is where I’m looking for the market to drop.
Even if the market goes lower afterward, that’s advantageous. Why? Because the Composite Man accumulates short positions in that buy-side liquidity and then rides it down to 4029.50.
The takeaway is this: this is how you benefit from these setups. It feels good to see the market deliver, to see it reprice to the levels we anticipated. That’s exactly what we want. But as a trader, your task is to analyze these price runs after the fact—and then relax.
Core Lesson: Buy-side runs often stop out shorts, but they also provide smart money the liquidity needed to build short positions. Study these runs afterward to refine understanding and maintain composure.
Look at today’s delivery. Observe what you see in hindsight. Go through the chart and annotate what stands out. Then go back and listen again—pause when I refer to specific things. If I mention another chart or another market at a certain timeframe, review those moments too and annotate what you see there in connection with this chart.
For example, the Dollar Index was failing to make a higher high at this point. What does that mean? Look at the chart: what pattern exists at that moment? Which PD Array or entry model is occurring right there?
When you finish, identify the ones that make the most sense to you. Going forward, focus on those—the ones you can see clearly and trust without feeling like you’re stretching to believe it. Today’s market delivery offers that clarity, and it’s there for all of you.
Core Lesson: Study charts in hindsight, annotate them, and connect observations across instruments. Focus on the PD Arrays and setups that are most intuitive and reliable for you.
Sometimes my dialogue makes it sound like this is the only way you can make money. No—I never said that. But this is the only way you’re going to be as precise as you can ever be, consistently. It’s the next best thing to absolutely knowing the future, and it delivers more reliably than anything else. You won’t get any closer than this.
It will repeat every day. Over time, your observation of the specific things you feel strongly about—those price behaviors you keep looking for when you open the charts—will improve. What you look for now might not be the same thing you’re watching later on, so you need to remain flexible with yourself. I’m being flexible as your educator; I want you to bring your personality to this.
What instrument you trade with ultimately may vary: it might be a currency, a stock, a bond, or even crypto.
Those are two envelopes in price: buy and sell. The algorithm goes higher into this area to trigger the buy stops resting above these highs, converting them into market buy orders. This is exactly what I’m training you to look for—these are the easiest reference points.
If you’re bearish and want to go short, this is where you engage. It feels uncomfortable, but that’s the opportunity. If you’re long, you want to be selling into those buy stops as price trades into them. That’s how I teach my 2022 model: engage price at that moment and place your sell orders to willing buyers at higher prices.
Think of it like a game of horseshoes. You’re tossing your orders into this area—the pole is the old high. Whether you use a resting limit order or execute manually at market, the mechanism is the same: aim to exit near that prior high. And there’s nothing wrong with getting out a little early.
Core Lesson: Buy stops above highs are prime liquidity pools. Use them as reference points for exits or entries—placing orders into willing buyers at premium prices, even if you exit just before the exact high.
Small gap here. If we can stage a rally above these highs and continue, we could be setting up for a big down day in equities. That doesn’t mean it will happen, but getting above this level could set the stage for a significant sell-off—a large range day down in the ES, NASDAQ, and Dow.
Core Lesson: A rally above key highs on dollar can stage liquidity for a sharp sell-off, leading to a large range down day in equities.
NQ
Implied Fair Value Gaps
These are your notes. You’ll see these things form in your backtesting, and you’ll also see them unfold live going forward.
If you see a big down candle, what makes it “big”? Compare it to the candles before it—this one is larger relative to those, which shows displacement to the downside. Is there a Fair Value Gap here? Not on this one-minute chart. But look closer.
In real time, I pointed your attention to it, and you’ll hear it in the recording. Look at this wick and measure it. Eyeball it. Find the consequent encouragement of that wick, and then compare it to the consequent encouragement of the next wick.
Between the consequent encouragement of the first wick at 12,264.00 and the next at 12,248.25—that zone is equivalent to a Fair Value Gap.
Core Lesson: Large displacement candles often create hidden Fair Value Gaps when measured between wick consequent encouragements. These subtle gaps are critical for precision entries.
Right there is equivalent to a Fair Value Gap. Now, you don’t see it directly on the charts. When I talk about things that are not obvious in the chart, this is one of those examples. The signature refers to what wicks can do—color outside the lines. That’s where the damage is done: outside of this implied Fair Value Gap.
Make sure this is in your notes and labeled as such. We don’t see a clear separation here, because if you extend it out, there’s no distinction between this candle’s low and the next candle’s high. A typical Fair Value Gap would show that separation. Instead, these two wicks overlap each other, offering no visible gap on this single down-close candle.
But because we have long wicks on both candles, you split each in half and use both consequent encouragements.
Core Lesson: Even when no clear Fair Value Gap is visible, overlapping wicks can form an implied Fair Value Gap. Identify it by marking the consequent encouragement of each wick.
Now, with the benefit of knowing what you’re supposed to see, look closely. What do you notice? Isn’t this like the fear you get when price gives a little “mohawk” above it? Because ideally, you want seamless price delivery.
Where does it really go? To the order block. What’s the opening? 12,268.50. What’s the high of that candle? 12,268.75—just one tick into the order block. Then look at the candle bodies: where are they forming?
This is what I’m reading when I analyze Fair Value Gaps, Institutional Order Flow Entry Drills, and related concepts. The midpoint is here. Do the bodies reach or touch the consequent encouragement of this implied Fair Value Gap? No. That tells the story.
The wicks cause the “damage”—they extend outside the lines. But the candle bodies are signaling weakness: they cannot close or open at the midpoint (the consequent encouragement of imbalance). Even though it doesn’t look like a clear imbalance, this is what the algorithm is responding to.
The Composite Man reads that as a signature of weakness: aim for sell-side. Retail traders, seeing the wicks and a bullish candle body, believe it will continue higher.
Core Lesson: Candle bodies, not wicks, reveal true strength or weakness. Failure to reach the consequent encouragement of an implied Fair Value Gap or any point of interest we watch (BISI/SIBI/Wicks) signals weakness and a likely shift toward sell-side liquidity.
The fact that price failed to reach the midpoint of the implied Fair Value Gap means it is likely to target sell-side below this low and make a lower low—especially when everything else in the market was already indicating that outcome.
Your eye should go right to that level, just as I’m teaching you. Price should have gone higher. If it had, I would then wait for another subsequent Fair Value Gap to confirm the setup I’m showing you here. But because it couldn’t reach the midpoint it should have reached, it signals extreme weakness.
Even though the wicks reached higher, I am not fooled by them—and you shouldn’t be either. The wicks will distract you. Traders and authors often overanalyze them, labeling dojis and comparing wick lengths, but that’s all conjecture. The market isn’t responding to wick length or some fraction of a wick.
The real signature is this: failure to reach the midpoint (consequent encouragement) with the bodies signals pronounced weakness. The same way we interpreted weakness earlier in the Dollar Index, it applies here as well.
Core Lesson: Ignore the noise of wicks. True weakness is revealed when price fails to reach the midpoint (consequent encouragement) with the bodies of an implied Fair Value Gap, signaling a likely move toward sell-side liquidity.
Same way we looked at the Dollar Index. Think of that level as the midpoint of the implied Fair Value Gap I showed on the NASDAQ—conceptually it’s the same thing. It went up real close to it, but then stopped. The fact it couldn’t get there (104.260 DXY High) is a failure. If it fails to run, it’s likely to go the other direction.
If you already had an inclination that it would go the other way—which is what I was saying in real time—then you’re positioned correctly. The NASDAQ was the leader and, while the Dow and ES had already made lower lows, NASDAQ had not yet done so. It will try to “keep up with the Joneses,” hurry and run down to catch up and bring symmetry back to the market when it wasn’t showing symmetry earlier.
Ask: where did it fail to reach the buy-side liquidity pool? Look at the candle bodies—where did they close and where did the next candle open? What matters is what price doesn’t do as much as what it does. The things not obvious on charts, not drawn in books and courses, are the signatures you must learn to see.
I’m teaching you to anticipate those subtle signs. When they form, they give you insight into where price will be delivered later. You’re effectively predicting the future with observations you won’t find in textbooks. That should excite you—this has been happening every day, and now you can go back to your charts and see it was there all along.
DOW
it was also raiding short term high inside that SIBI
It’s a High-Resistance Liquidity Run. Yes, price will go to our objectives, yes, it will reach lower—but notice the retracements on the way. In a High-Resistance Liquidity Run, there is a higher likelihood of short-term stops being raided. That’s how you trade this type of environment.
What do I mean? All the sell-side that was not efficiently delivered will later be offered on the buy-side. At one point, this candle looked like a strong bullish move, coming into this area. But what else was happening? Right above that short-term high, trailing stop losses were being hit. Traders on the short side were fearful, unaware of the 4029.50 level in the S&P or how to read other markets for confirmation that sell-side liquidity pools were the draw.
Instead, they pushed their stops right behind recent price action—something you cannot do. When you see my examples, I don’t do that. I scale out partially, teaching you how to avoid trading from fear. In the beginning, you just want to avoid losing. But you must accept losing before you truly learn how to trade. That’s where the real lessons are. You’ll see your weaknesses exposed—impatience, impulsiveness, gambling, chasing, or being too slow to act. Don’t hide from these flaws. Identify them now while practicing, so you can create coping mechanisms and replace bad habits with stronger ones.
In a High-Resistance Liquidity Run, expect frequent raids on short-term stops while the market still trends lower. As a new trader, every raid above a short-term high may feel like a shift in market structure—but it’s not.
Core Lesson: High-Resistance Liquidity Runs still move toward objectives but with deeper retracements and frequent stop raids. Accept losing as part of learning, and don’t mistake every stop run for a market structure shift.
Keep learning with us.
Get new ICT lessons, study notes and updates as we build V2.