
Market Review - February 12, 2023
02:43 - The economic calendar for this week. 04:45 - Daily and weekly charts of the dollar. 08:36 - Where does the market open on Sunday?
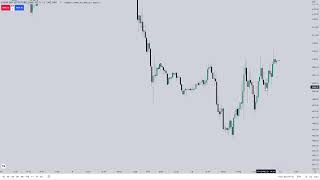
URL: https://www.youtube.com/live/wWvFUW-jY4w?si=zSeGSJbmWYNTHd0k Watched Date: February 12, 2023
Outline
02:43 - The economic calendar for this week.
04:45 - Daily and weekly charts of the dollar.
08:36 - Where does the market open on Sunday?
14:14 - What is a short stubby wick?
20:54 - Order flow needs to be bearish -.
26:30 - What happens if the dollar goes higher and index futures drop?
29:37 - What’s going to happen before the CIPI?
34:33 - What is a liquidity void?
39:21 - How do the current market conditions relate to the entire spectrum of experience of a trader?
46:00 - Daily and weekly charts -.
50:10 - It’s easy to derail someone that already knows what they’re doing if you don’t believe that.
56:13 - Don’t lose sight of what chart you’re on.
59:35 - The importance of having a chart -.
01:06:39 - Hourly chart of the market.
01:12:04 - Why a gap opening below Friday’s close is not equal to the same expectation I would have had if a gap higher formed.
01:17:46 - Why you need to be sitting down with someone and explain why they’re doing what they are doing.
01:24:24 - The likelihood of a gap lower coming up.
CPI is on Tuesday, and that is the day the markets are going to get wrecked. It will be a mess. You want to be very careful and avoid participating at all before CPI. After the release, there is nothing wrong with engaging and going after whatever remains in terms of liquidity or imbalances, but prior to the announcement, you should stay out.
watching Weekly PWCE on the coming weeks
watching BSL and old V.I. on Daily chart
I do not know where the market will open on Sunday, and no one does. It is a complete mystery, so we all have to wait and see how the market begins its week. Whatever the new opening price is on Sunday, that is when we will have the data to start working with. Right now, we have no idea where it will open, so I must simply record my observations, noting both premium and discount, without attempting to frame a narrative.
I am hopefully inspiring you to look at both sides of premium and discount. Then, when the market opens, we can observe what price gravitates toward. At the same time, we must keep our expectations low on Monday, because the CPI number coming out on Tuesday is the real event. That is the move that will bring the most volatility and cause much of the market’s violence.
➡️
As soon as the market opens on Sunday, you are going to measure the midpoint between Friday’s closing price and Sunday’s opening price. The difference between the two creates the consequent encouragement for the new week’s opening gap. You should repeat this process for every market you follow.
That entire range contains three specific levels, and we carry those levels all the way through to Friday’s close, because the market is going to refer back to them.
➡️
See how long this candle is and how little the tail or wick is. That, to me, is a very short and stubby wick in relation to the candle’s full range. How do I determine whether a wick above or below a candle is short and stubby? It’s relative to the candle’s size from high to low. That becomes your reference point. Compare it with something different, like a candle with a long wick that makes up the majority of its entire range. In contrast, the wick on the low of the first candle is short and stubby.
Many times, and this is something you should have noted in your journal and study notes, that type of low will get probed without being broken. Price will often stop at consequent encouragement right there. Visually, what I’m referring to is price dropping down to it, or just a little below it, then retracing, and at a later point, coming back down through it. Whereas with a long wick candle, generally, if you’re positioned in the right direction, it behaves differently.
➡️
If you are looking at a wick like this and you are bearish, many times price will go right to consequent encroachment, stop dead in its tracks, and then reverse. Other times, if the market is very weak, it may only retrace about one quarter of the wick before stopping and dropping lower, without even reaching consequent encroachment. When that happens, it is a strong indication that you are in a very bearish market. Normally, you would expect the algorithm to reprice back to consequent encroachment of a wick, but in this case it cannot even reach that level. Instead, it only trades to the quarter range of the wick. When doing this, you are not measuring the full body high to low of the candle, but rather the wick itself. For example, if it is a long upper wick, you measure from the candle’s closing price up to the high, and then consider the quarter range and the midpoint. These relationships will serve you well as you move forward in your study of price action.
We have this wick on a small down close candle right here. The next candle opens, trades up, and then comes back down. If that next candle forms and price trades up into what would essentially be the midpoint, or consequent encroachment, of the wick, we don’t know in advance that this pattern is going to form. But if it does, you will often see that when the market is bearish, price will fail to reach that consequent encroachment level. And you can see that exact behavior happening right here.
I’m talking about order flow.
When price is moving lower and you expect it to deliver into a discount objective or target, you should look for up-close candles to act as resistance inside any fair value gap. These should keep price from pushing higher.
You want to see the low of the fair value gap, or its consequent encroachment, serve as the defining boundary for retracements. Once price trades into those levels, it should reject sharply and move away with speed—it doesn’t like to linger there.
If you see these signatures while price is printing lower, then you are observing a sell program delivering. That’s confirmation the order flow is bearish.
Risk-off means there’s a flight to quality. You can decide for yourself if you believe the dollar is quality, but generally in risk-off conditions the dollar gets bought up. A stronger dollar pressures foreign currencies, so even if you have a buy program in forex pairs, equities, or index futures, when the dollar is rallying it becomes very difficult for those markets to gain traction. They may rally intraday against dollar strength for a short while, but usually it’s short-lived and then price rolls over in the opposite direction, aligning with the stronger dollar.
It works like a teeter-totter effect—when one side goes up, the other usually goes down. But don’t assume it’s always lockstep on every tick. Sometimes intraday price action will move in tandem for a brief moment, and that can be confusing for new traders who expect perfect correlation. That’s why intermarket analysis is so important.
For example, I don’t trade the Dow because it’s too spotty. The index tends to overreact more sporadically than the NASDAQ or the S&P. The NASDAQ itself can also overreact and overshoot compared to the S&P, while the S&P generally trades much smoother, more controlled, and with less erratic exaggerations in price. The Dow can whip around in ranges, chopping before eventually falling back in line with the NASDAQ or ES.
SIBI as I usually abbreviate it on my charts, refers to a sell-side imbalance. It occurs when price action is heavily one-sided, often represented by a single large candle moving downward. This indicates a lack of efficiency on the buy side, meaning the market will need to offer liquidity at a later time with movement higher in price. Typically, the market tends to reprice back up into the range, often reaching as far as the previous candle’s low. If we’re bearish we don’t want to see it reaching that far. C.E. and lower half would be favorable for our bearish ideas.
Everybody knows that when CPI is being released, it acts like a tornado, a tsunami, a weapon of mass destruction where the market can be instantly devastated. Anyone on the wrong side of the trade is at risk of getting hurt. Because I expect that level of carnage on Tuesday, like every other trader does, Monday’s trading is likely to be relatively uneventful. I could be wrong, but I don’t anticipate much significant movement ahead of CPI. Trading on Monday is possible, but you shouldn’t expect a massive range.
If we’re expecting lower prices, the ideal signature on Sunday’s open would be a gap down followed by a rally back into that gap overnight or into Monday morning. Then we observe whether there is a willingness for prices to move lower. If that occurs and intraday lows on Monday remain relatively equal, those relative equal lows can carry into Tuesday ahead of the CPI release.
Because CPI is the major event on Tuesday, it isn’t necessary to see a large gap down at the open; the market may open relatively close to Friday’s close. When I observe that, I interpret it as an indication that Monday will likely be quiet, with traders waiting for the CPI release. This is a reasonable expectation that anyone analyzing price technically would anticipate.
If we see a significant gap lower, it creates an excellent trading opportunity for Monday, even though the major event is on Tuesday. The reason is that the difference between Friday’s close and Sunday’s open forms a large gap. On Monday morning, the market will often have a tendency to rally into the range created by this gap between Friday’s closing price and Sunday’s opening price.
In the indices market, you need to consider what occurred in the previous session, how the market closed, and where it opened at 9:30. That difference represents a real liquidity void. The opening price at a new day or a new week creates these liquidity voids because no trading has taken place in that range.
The fact that the market didn’t fully retrace to that area and close into the low of this candle indicates weakness—decisively weak. This aligns with the characteristic I taught you about wicks: if we can’t climb to the midpoint of a wick above a candle while bearish, it strongly signals a market that is likely to move lower.
Swing high is formed after REQHs is taken
➡️
At the 9:30 opening, I physically record the opening price. I also keep track of several key levels I’ve noted—weekly highs, weekly lows, or other significant points. I constantly refer back to the opening price in relation to these critical levels.
By recording these levels in an order and noting how each price stacks from high to low in the grand scheme, I create a clear reference framework. Once a level has been traded or touched, I circle it on my notepad. This indicates it has already been hit, so if the market returns to that level later—say, the next day or on Thursday—I don’t need to mark it again on my chart; I already know its reached at least once.
I’m thinking, “Okay, it’s reached this level—what’s the next level of interest above that which hasn’t been booked or printed yet?” Once I identify that, I know it’s likely to move through this level into the next one. That next level above is where my focus lies if I’m bullish.
You have no idea how much having these levels drawn on your chart will influence your analysis. You might get fearful, thinking, “Oh, it’s going back to that level,” or subconsciously recalling, “Last time it reached this level, it did this—or didn’t do that.” That can become a distraction from observing what price is doing in real time on your one- and five-minute charts. The key is to keep your focus on the essentials: where liquidity resides and where inefficiencies exist. Make sure to bring those levels down from the higher timeframes for context.
“Graduation is when you can see the setups, execute them, and read price action with nothing on your chart and no input from me. At that point, you won’t need ICT videos or live streams anymore. That’s when you know you’re independently minded and confident in trading on your own. That’s the goal I have for you—and the goal you should adopt for yourself.”
There are two distinct types of volume imbalances. One forms during bullish delivery, aligned with buy-side, where the candles close higher and the next continues higher. The other forms in bearish delivery, where a down-close candle is followed by another down-close. The key is to distinguish between them and observe how price reacts—if it revisits either one, it will respect very specific levels.
That’s why it matters—they’re not the same. If price trades back into them this week, I’ll revisit this point and show you what’s important to take away. Without marking them, you’d miss that context entirely. Of course, they might not even come into play this week; we don’t know yet since the new week hasn’t opened. Still, I note both alignment balances in my journal and keep those levels in mind.
It’s not a lot, but you want those levels annotated clearly. Record not only the price level but also what it represents. For example, note: “Opening price, January 30 daily candle” in a very small font. Keep the chart uncluttered but precise.
Do the same for other key references—such as “January 30, mean threshold, daily bullish order block.” This way, each level carries its context, and you won’t forget its significance later.
On this range, my eye is working from the low up to the high, and I’m focused on finding the midpoint—even without a Fibonacci. That midpoint is equilibrium, and right now we’re trading essentially at that level.
Why did I choose this particular high and low? Because that’s where the most dynamic price movement occurred—from this low to that high. That defines the parent dealing range. All the smaller retracements and minor ranges are subordinate to it.
From this parent high to low, the relationship is premium vs. discount. Splitting it in half, everything above the midpoint is premium, and everything below is discount. At the moment, we’re sitting at equilibrium.
The key question then is: how much time has price spent in discount vs. premium? Clearly, it’s spent far more time in premium. We dipped briefly into discount, but the market quickly snapped back to equilibrium.
I don’t want to read too much into this since it’s Friday, and what we’re seeing is Friday’s price action—we don’t yet know how the market will open.
But let’s assume we open lower. If that happens and price rallies back up, it could use the closing price—or even any one of these hourly candles—as a reference point. It doesn’t necessarily need to return all the way back to Friday’s close, especially if the market is weak and we’re expecting lower prices alongside a stronger dollar.
Why? Because we essentially closed at equilibrium, and price has already moved back and forth multiple times here. That weakens the need for a clean, full retracement to Friday’s close on a lower opening.
Now, if Friday had closed much lower—say, extended like in this example—and then we opened lower on Sunday, I would expect a full return back to Friday’s close. The difference is context: when the market is stretched going into the weekend, the likelihood of retracement to the prior close is much stronger.
If we open with a gap lower, we wouldn’t require a full return to the FRI closing price.
It’s signaling weakness—heaviness in price action—and that suggests the market will want to reach into this low and attack it. Beneath that, we have sell-side liquidity resting, which is exactly what the market is likely to target.
That’s why you want to keep the fair value gap noted. Instead, focus on those downside levels as discount objectives—the lows and the liquidity pools sitting just below them.
Conceptually, a gap opening below Friday’s close is not equivalent to a gap higher. We’ve already spent significant time above the midpoint of the prior low-to-high range, so the market must be viewed in terms of overbought and oversold conditions—without relying on any indicators. Look at the rallies here: six attempts failed before Thursday finally saw a drop.
We can’t know yet if the market was taken lower to accumulate sell stops for a push higher. The clue will be how we open on Sunday. That opening will heavily influence whether the market resumes upward or, if lower, I don’t expect a return to Friday’s close. Right from the start, I’m expecting noticeable weakness.
➡️
Because we’ve returned essentially to equilibrium, I would favor a downside gap.
Flipping the script: if we open higher after Friday’s sell-off and climb back above that level, I would consider it a breaker, with the closing price being all that’s necessary. I would interpret it as the open trading back down into the range, which acts as the breaker. From there, it could retouch Friday’s close, and I’d expect it to attempt to reach the inefficiencies created on Friday. If it responds at Friday’s close and continues higher, that would indicate my initial market expectations were likely incorrect, and the move could extend further on Tuesday’s CPI.
What I just outlined is not a concrete plan A; it’s not Plan B. I don’t know which scenario will play out—I have to wait and observe Sunday’s opening. Based on that, I can weigh the possibilities using the framework I just explained. This is forecasting: a way to internalize what I expect price to do, but it does not equate to a trade entry yet. Trade execution comes later.
These observations give me a framework to justify bias—but I never hold a bias before Sunday’s open. I only have an inclination of what I’d like to see in price. My will cannot force the market to act; I must align with what the market does. The two scenarios I outlined represent the conditions I’d like to see if I were looking to go short or long, especially if I anticipate the dollar moving higher.
It gives me a plan of action: if price does X, I’ll respond with Y; if price does Z, I’ll respond with W. Most retail traders just chase the market without this logic. I approach it analytically, considering that last week the market spent more time attempting to move higher.
➡️
If you’re trying to learn to do this independently, the worst thing you can do is subscribe to someone’s signals without them explaining why they’re taking those trades. In my opinion, that only creates anxiety, because you become dependent on that person. What happens if they decide not to show up one day, or they’re distracted, or they simply have a bad day? You’d be placing your financial decisions in someone else’s hands without ever understanding their reasoning. That requires more blind faith, in my view, than just putting in the work yourself and learning to build your own analysis. When you know why you’re taking a trade, you’re in control.
If I’m bullish, I’d prefer to see a gap higher, then a return all the way back to Friday’s close. From there, I’d wait for the market to show a willingness to rally. That means I’m not blindly buying just because price retraced to the closing level — I want confirmation. Specifically, I’d look for a shift in market structure after the retest of Friday’s close before considering a long position.
Flipping the script — if we gap lower, I don’t need price to trade back to Friday’s close.
If it gaps lower, price can attempt to trade higher but leave the gap partially open—it doesn’t need to return fully, or even halfway. In fact, it’s better if it doesn’t, because that would communicate excessive weakness: the market can’t even fill the gap.
That’s what you want to condition yourself to recognize each weekend before Sunday’s open: anticipate how price might behave around the gap, not because you’re trying to predict the exact opening location—that’s impossible—but because you’re training your analytical process.
Think of it as case study work, forward testing, and confidence building. The key isn’t knowing where it gaps, but how you respond as an analyst once it does.
For example, if it gaps lower, you should ask:
- What do I reasonably expect it to do?
- What would I not want to see?
- What is less likely to occur?
One unlikely scenario: a gap lower that immediately rips higher and fully closes. While possible, it’s less probable than a gap lower, a partial attempt upward that leaves the gap open, and then price working lower to reach sell-side liquidity or dig into an hourly consequent encroachment wick.
On the 15-minute timeframe. Alright, so we've had 1-2-3 times as a three drives potentially pattern and that's why I would also like the fact that we get lower I would put more emphasis on this reaching just simply get into the liquidity resting above here.
Why was it doing this? Higher, higher, higher, because the liquidity that was trailed behind this high as the market went lower, it was taking that liquidity starting to break down, what happens then any stop that was higher than this was brought back down to what? This high again, they come right back above, skip this high, right back above this high again, with this run. Then they start dropping it again. Okay, now it finally did it. Now we can get short. Where's the stop loss that rate back to an old high, you might be thinking here and here. But my focus my eyes go on the marked high. And they take it once more time of again, it just so happens that I've taken out each individual high two, which is killing two birds with one stone. That's how I'm internalizing that price action.
➡️
If the market does anything outside of these potential scenarios, I will sit on my hands and do nothing. I’ve outlined the upside if I’m wrong and the downside I’m watching for. If my anticipation won’t occur, I won’t act—and I won’t be anxious about it. I’ll be perfectly content waiting, because I’ll need more information when Monday opens at 9:30. There are no significant news events on Monday to influence price; the real driver is Tuesday’s CPI release. Most traders will sit idle, and there won’t be much movement until the market reacts CPI data. There’s no reason to chase big moves on Monday because the major movement is predictable and will come with Tuesday’s CPI.
Keep learning with us.
Get new ICT lessons, study notes and updates as we build V2.