
Market Review - February 10, 2023
05:29 - John’s audio is getting better. 09:34 - Volume, volume, and volume imbalance. 16:16 - How far can the market overshoot to this low?
URL: https://www.youtube.com/live/STEGBblm4dI?si=APBrFvezEaWWmY4d Watched Date: February 10, 2023
Outline
05:29 - John’s audio is getting better.
09:34 - Volume, volume, and volume imbalance.
16:16 - How far can the market overshoot to this low?
23:19 - Watch the price action of mini-bison.
27:39 - What is spotty price and what does it mean?
36:38 - What do you want to see in your recorded trades?
43:52 - Why this low needs to stay in place and what to expect.
49:09 - What’s the high on the high today?
55:56 - Looking at the highs as resistance to the hit.
01:03:15 - If you’re taking live trades based on Livestreams.
minute 23
➡️
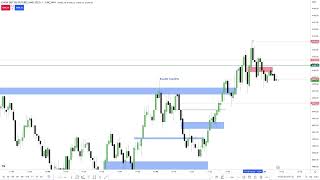
Look how spotty price is right now. And meaning, what do I mean by spotty? You have volume imbalances in here, here, here, and the one over here. So it makes it difficult to get a real smooth, like, obvious run to this price level react and go lower or run this price level, react and go higher. So it can go back and forth. Because it’s referring to all of these specific PD arrays, which makes reading price and taking a trade much more difficult to trust. And where would you place your stop loss because it can bang around in here, and then ultimately run on one of them as its baseline premise, with supporting it as the PD array or the multiplier for price to start moving away from. It’s hard to get a read on that when there’s multiple ones like that. So when I say market’s spotty, that’s what I mean by it has multiple volume imbalances. It’s very porous, put it that way. And when there’s porous pockets in price, it’s going to want to spend more time in there, rebalancing that. And the way you rebalance is you reprice to it, you leave it, go back into it, and fail and go the other direction. And since there’s multiple ones, it means you’re going to see it go back and forth, back and forth.
minute 31
Now, because we have this gap here, the one shaded, and we have a swing high, we technically have a “market structure shift.” After trading into a discount fair value gap, after taking sell side here with this drop down, we’re bumping up against this fair value gap. If price wants to go higher through this fair value gap, you have to be mindful of that. You can’t just take a long here and put your stop loss there, because of this inefficiency—it can come back down into it. So your stop would have to be down here around 4089. We’ve had a really clean delivery to the low of the fair value gap here, and now we’ll see if it wants to rally up and start pulling higher.
➡️
This is our bearish order block. We want to see this act like a speedboat—meaning it shouldn’t slow down when it hits this area. Ideally, price should not just enter it, but move right through the midpoint of the candle, which is the mean threshold. When I’m watching an area like this and considering whether price will reach for buy-side liquidity or attack the daily high going into the Friday close, I look for price to quickly move into the candle’s body and break through the mean threshold. That’s the qualification, the signal that I’m on side and confident it will do what I expect. If price only runs up to it, bounces away, and lingers, that’s not ideal—it suggests possible consolidation or even a full reversal against the idea.
We would want to see it rip into 4095.25 aggressively and run right through it. If it’s going to rally and target the buy-side, that’s how you know to trust the move. The reason is because it tears into the order block without respecting the mean threshold, which is this red level here.
We don’t want to see it go into the order block and fail to run up into mean threshold and tear through it. Instead, it’s retracing back down into the fair value gap, which is not ideal. It makes it much harder for price to turn around and push higher from this point.
We want the next candle, once it opens, to immediately run higher—no hesitation, just rip upward. Does it tear through mean threshold? That’s exactly what we want. We don’t want to see it respected. What you’re watching for is making sure the candle doesn’t turn against you. It must stay above its low and dig through.
Now we’re okay. From here, watch the buy-side. Much like the order block example, we want the same behavior here with this fair value gap.
We want to see large range expansion. Usually, when I record my trades, I’ll type out that I want to see speed and distance—or, in bearish cases, a sharp decline. But if I’m looking for bullishness, I want to see big green candles with strong upward closes.
When I see that, it feels like confirmation that I’m on side with the move. If I’m expecting it, I reasonably expect price to push through here. Once it does, I want to see it expand upward with strong velocity and speed, digging into this level and taking out that high.
➡️
I need three PD arrays. Once I see three of them break, then I'm going to look to collapse a trade or take some of the trade off.
➡️
You could roll your stop to plus one and see if there’s a run into new highs on the day. But you don’t want to limit how much you can capture, because as it gets close to the 3:45–3:50 window, the macro move in the last hour can really push it higher, running through here and extending further. So you don’t want to shortchange yourself on that opportunity. You could set a limit order to take partial profits at the new high, then keep a runner to see if any additional expansion materializes. We don’t know if it will, but the potential is there.
The mean threshold is at the wick here, about the midpoint drawn out in time. You’re watching to see if price touches it—and if it does, does it disrespect it and go right through, or does it fail to even reach it and resume going higher? That’s what I’m considering when watching price. I’m reading very specific algorithmic price levels that align with what you’d expect from support and resistance, and these levels do provide that.
Notice how price went down into this wick here—consequent encouragement—beautiful redelivery to the buy side. You’ve probably noticed that when I’m looking at a run, every time it makes a new high, I annotate it like this and take a partial when it hits there. You’ll be doing it too. This is called running down equity.
Now, because we’ve had one high taken here and then this high took out that high, we don’t want to see any kind of reversal. This low here needs to stay in place. We don’t want to see any of that coming back, because then it’s problematic. What we want to see is an energetic, big run up into 4104–4105 with large candles pushing hard, because there are a lot of orders resting up here.
The books will tell you to put stops right above the high, but some other traders and funds will go a little deeper, thinking they’ll be protected. That’s why in the later parts of the day, old intraday highs and lows often get completely run out—because the market is seeking that liquidity. Funds don’t just place stops one tick or one point above; it can be several handles, sometimes as much as 10.
So what do you do with the algorithm in the last couple minutes of trading? If you identify a liquidity pool that’s likely to be run out—which is what we were watching today with this high—if it runs through it before the 10-minute market-on-close macro, then it will aggressively reach for the liquidity resting above that high. But since it hit ahead of the macro, it’s already delivered by running through the high. That means it may have a small flurry, maybe push a little higher, but then the macro will dig back into the daily range.
Why does it do that? On an up-close day—unless it’s a strong trending day—it rarely closes right on the high. Typically, the intraday high is formed, then price pulls back from that high and closes near it, but not at the very top. That’s what the market-on-close macro was facilitating.
Keep learning with us.
Get new ICT lessons, study notes and updates as we build V2.