
Market Review - February 09, 2023
05:39 - Can you hear me? 06:57 - How to get the audio to work. 10:51 - The New Week Opening Gap -.
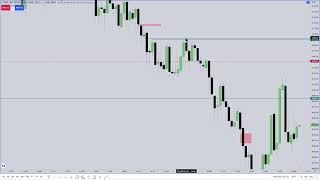
URL: https://www.youtube.com/live/GFdWahZUNOw?si=kVyJRZyTLf4y0K_n Watched Date: February 9, 2023
Outline
05:39 - Can you hear me?
06:57 - How to get the audio to work.
10:51 - The New Week Opening Gap -.
14:04 - What are you looking for in this trade?
20:20 - Watch that midpoint between the two levels as I'm talking my eyes.
26:26 - What I want to see from this candle.
29:32 - What happens if the price goes down and hits my level?
36:22 - The best way to read the price of candles.
41:24 - What is a chart of price action?
45:24 - Paint roller vs. price continuum -.
51:34 - Why the algorithm is coded this way -.
57:50 - What’s the mid-point of the range?
01:00:38 - Why you need to know what you’re not supposed to see.
01:08:12 - Think of it like a pothole on the road -.
01:14:51 - What’s the low of this candle?
01:17:18 - You’re wasting time worrying about stuff that has no bearing on your development.
01:23:23 - If you’re an afternoon session trader, you have the advantage with the last hour of the day.
01:30:15 - What is the swing low?
01:34:00 - How do you know when a candle is going to get tripped?
01:39:55 - Don’t look at price action as a limitation.
01:46:22 - What’s the open on this candle?
01:49:18 - Why price doesn’t need to come back up into this range.
01:56:08 - The importance of understanding the order flow -.
➡️
minute 26
So now when we have levels like this, see these wicks here, we have the wick there, this wick there. We have a wick here, and here. And it's this one single candle.
I don't want to see it trade back up into that area, I want to see it remain heavy, because we've had multiple times passing through that range.
So it should act as a balanced price range and not want to go back up to near as if it does trade back up in the air, then it's probably gonna have a deeper retracement and come back up into this area, which in my mind is problematic for me getting to my target, which is within earshot of where it's at now.
➡️
By observing price action, you can identify patterns like PD arrays, breaker order blocks, fair value gaps, optimal trade entries, institutional order flow drills, or mitigation blocks. When I highlight one, notice which ones resonate with you. The patterns you spot easily—those you recognize and anticipate—are likely best suited for your trading style. Doesn’t that make sense? Learning from someone who encourages you to incorporate your personality, comfort, and observations into a specific price action element that clicks for you is far more effective than me insisting, “You can only trade fair value gaps.” That’s too rigid.
Sometimes, my animated lectures might seem dogmatic, but I’m a realist. I know one approach doesn’t fit everyone. You each bring unique personalities and quirks to your trading, and that’s something to embrace. As a mentor and educator, I must allow for that individuality. A good teacher empowers students to discover themselves through the concepts and principles taught. This builds confidence because you’re applying the tools in a way that reflects your own expression and understanding of price action.
You’re not just following a rigid model I dictate. There’s no single way to trade my concepts. Each of you can develop a completely unique model using the same principles I teach. It sounds crazy, but it’s true.
minute 40
Focus on this area: the remaining balance of the gap between that high and this low.
We are watching the reaction of the remaining open portion of the marked SIBI later named as Volume Imbalance
➡️
You were expecting price to go down to that 4103 level, and you saw this setup up here. You saw a price straight up into this fair value gap.
This small area is like a spot on a wall where a paint roller didn’t evenly apply paint. Imagine the chart as a blank canvas, like a wall before painting. When a painter first rolls paint onto the wall, it’s thick and abundant. But as the roller moves downward, small pockets or pores form where the paint isn’t fully distributed, leaving uneven spots. That’s what we’re seeing here: the price action moves down, but this small area represents a gap where the "paint" didn’t fully cover. Ideally, a painter would reload the roller and roll back over this spot to fill it in before moving to another section. Does that make sense?
➡️
minute 47
In this area, price moved in both directions, like paint applied unevenly. From this candle’s high to its low, the next candle opens here, trades below the previous candle’s low, then rallies back up. This leaves a pocket—an area where price didn’t revisit after moving down. Between this candle’s low and high, there’s an inefficiency in price delivery. Price operates on a continuum, constantly seeking efficiency to offer fair value, which evolves throughout the day. When an inefficiency like this forms, the market tends to revisit it, similar to a painter rolling back over a wall to evenly distribute paint where it’s already been applied.
➡️
Examine the range between this candle’s high and low. The market moved down and then up within this zone. On a micro scale, this small area represents a compact balanced price range.
➡️
My structured approach to rule-based trading relies on PD arrays within the context of market structure, guided by a bias formed from a narrative. This narrative heavily draws on a higher timeframe premise, specifically the weekly chart. I consistently apply the same methods, but they are highly specific.
➡️
minute 52
You might aim to enter a short at that candle’s high or its midpoint if you’re striving for precision. However, chasing the exact high often leaves a small portion unfilled when price doesn’t reach it. Here, I’m showing how the algorithm efficiently revisits a balanced area, overlapping where it’s already traded. This isn’t an error or a lack of precision—it ensures no gaps remain, delivering price efficiently. The candle bodies reveal the true story, where the real action happens, while the wicks show the extremes. To understand price’s narrative, focus on studying the bodies.
➡️
You can see how price moves right up into this area and stops at these wicks. You must accept that your trades will experience some drawdown if you enter at SIBI Low, along with consequent encouragement. Within this range (BPR marked in blue), price is balanced, having made both passes: this candle dropped to this low, then the next candle opened here and rose this much. Only the range between this candle’s low and that candle’s high. In this four-minute interval, with each candle closing roughly every two minutes, price has oscillated back and forth within this range.
➡️
Don’t let anyone tell you lower timeframe charts are just noise—they’re not. They reveal what price is doing, just like an hourly or daily chart. If you watch a daily chart from market open at 9:30 AM to close at 5:00 PM, or observe price on a lower timeframe, is price behaving differently? It’s doing the same thing.
➡️
minute 58
The range between this low and that high, when measured, gives you a midpoint level—the mean threshold. Why? Because we’re measuring candlesticks with bodies. If it were a gap, like a fair value gap, the midpoint represents consequent encouragement. Consequent encouragement defines what’s permissible within a range.
How far can you overshoot this fair value gap? The midpoint between this candle’s low and that candle’s high defines the balanced price range.
➡️
hour 1 minute 2 more on balanced price range
It hits that level perfectly, then moves lower, leaving this area. It trades back up once more, ensuring no gaps remain—like mowing a lawn to avoid any "Mohawks." It’s seamless, then breaks lower. It trades up again, hitting the midpoint of the gap—what I call consequent encouragement. When you see this, you think, “Okay, this is likely the last time.” Why? Because it has already reached the midpoint of the balanced price range. Your targets, the terminus levels you’re anticipating, are what price is drawn to. The completion is time and price.
➡️
hour 1 minute 4 very important info about swings that won’t be breached
when it goes up into this level here, you're anticipating it to do what? Never, never go back up here. It no it has no need to do that.
What’s permissible? Price can revisit the fair value gap because it’s an old inefficiency.
In contrast, the range between this candle’s low and that candle’s high(BPR) is efficient. Why? Because price has traded in both directions within this range, achieving balance in order flow and price delivery.
Price delivery occurs with every new tick and fluctuation in price action, representing a new valuation of the asset. We’re measuring how frequently price delivers within this range, specific to these two candles, and how many times it passes through that same price range over time.
The entire range between this candle’s high and low is balanced. Price can revisit the midpoint of that range—that’s normal, and I account for it in my analysis. It’s rare for price to return to the top of a balanced price range, but if it does, I’m likely preparing to exit the trade. I use these PD arrays as points of interest to gauge whether they can hold off an advance or retracement against my position, similar to how you’re taught to use support and resistance.
➡️
The primary function of price is to follow time, acting at specific intervals. It then delivers price based on an efficiency and price delivery continuum, constantly offering fair value. If the market moves too quickly in one direction, it adjusts to maintain that balance.
➡️
hour 1 minute 8 reclaimed fvg
Notice that these wicks trade up into that same old inefficiency. All this is showing is a reclaimed fair value gap. Reclaimed means price simply returned to that gap and is now treating it the same way you would expect a resistance level to be respected. If the market is going to go lower, it will push up into that level, fail, reject it, and then send price down again. That’s exactly what you want to see. You should not be alarmed when the market rallies back into these areas because behind it we already have a balanced price range acting as the defender.
➡️
If you know what I’m teaching you, and I know it, I don’t worry about missing a move. The sun might not come up tomorrow—that’s always a probability, though not a very high one. The world could end, and anything could happen. I could be called to meet my maker sooner than I expect. But barring those extremes, if the market opens tomorrow, I’m going to see these same things occur in price action. You’re going to see them as well. They cannot hide it from you. They can’t. You should not worry about my algorithm being changed.
➡️
Now let’s look through the lens of your trading model. Say it’s the last hour of the day—around three o’clock to four o’clock New York local time. If that’s the window you’re trading, you have to understand where the market is likely to go. Where is it trying to reach? What is the draw on liquidity? That is the number one thing I emphasize to my students. You may not master it quickly, and that’s exactly why I teach that premise first. If you begin by working on that as your first hurdle—focusing on it with time, devotion, and repetition—then you’re doing it correctly. Once you get that down, the other skill sets, like executing entries, become very easy.
➡️
Manual intervention is always a risk. It means something unexpected can happen—a black swan event—and suddenly, boom.
➡️
If you’re the type of trader who works in the last hour of the day, you’re not trying to be active at the opening bell at 9:30. You’re not guessing what the range will be or trying to call the Judas swing, or worrying about how far the market might move. That’s outside your focus, and you don’t concern yourself with it. You don’t panic about what you might have missed earlier in the session. Instead, you’re waiting for the afternoon. If you’re an afternoon session trader, your attention starts around 1:30 and carries through that time window, leading into the last hour—up until about 4:15, when the closing bell rings. After that, the market continues trading until 5:00, and then it closes for an hour before reopening at 6:00.
If you’re trading the afternoon and want a really small window to focus on, the three o’clock to four o’clock hour is where setups consistently form. Many of my students like this framework because it narrows everything down to a concise, sixty-minute period. It allows you to trade with the benefit of everything that has already unfolded during the day.
It’s similar to how I teach Forex traders to focus on the New York session: they have the added benefit of London behind them. If they understand where the market is likely to go on the higher-timeframe chart, most of the guesswork about the day’s high or low is already settled, since London tends to form it. Then they can simply trade in alignment with that unfolding bias, targeting the higher-timeframe draw on liquidity, without worrying about getting whipsawed by entering too early.
The last hour of trading gives you a comparable advantage. By then, you have all of the day’s hindsight to guide your decisions.
Behind you, in the morning session and the lunch period, there’s often that first thirty to forty-five minutes of manipulation that runs against the stops from the morning. If those stops aren’t taken during the lunch hour, you can anticipate it happening between noon and around 1:30 or 1:45. That’s why, if you’re going to be an afternoon trader, you want to start observing and studying price action around 1:30.
But if you don’t want to spend much time at the charts, you can begin your session at about 2:45. Sit down, take fifteen minutes to review what’s already happened, and determine what the market is reaching for. You must know what the draw on liquidity is—where price is gravitating, what target it’s being pulled toward like a magnet. You’ll identify that on the daily chart, the four-hour, and the one-hour chart. Those are the timeframes that reveal the highest-probability liquidity draws.
The direction of movement you’re trying to trade comes from the higher perspective of the weekly chart: is it more likely to expand higher or expand lower? You’re not predicting the weekly closing price on a compressed one-hour view. Instead, once you know where price is likely being drawn, you focus only on setups that align with it—whether it’s premium vs. discount arrays, fair value gaps, institutional order flow entry drills, breakers, order blocks, balanced price ranges, or mitigation blocks.
Whatever PDA you find easiest to use—the one that makes the most sense and resonates with you—that’s the one you’ll lean on. But what happens if that PDA doesn’t form? Here’s the reality: you’re going to miss the trade. Get ready for it. I miss trades too.
Homework of finding out what 4088 level is
➡️
In the last hour of trading—around three o’clock—we see price run up into the volume imbalance (SIBI’s remaning unfilled portion is mentioned as a Volume Imbalance here). That sets the stage. The question then becomes: does that level hold? Does it push back against price? Yes, it does, and price begins moving lower. From there, the next step is to ask: what’s the next clue?
The swing low was taken, but notice it didn’t close below it. I never said it had to.
A market structure shift only requires a pierce—it doesn’t matter if it’s just by one tick. That’s all it takes. You’re essentially waiting for that swing to be taken.
Why that swing low? Because price had already moved into the volume imbalance, with the expectation that it would trade down to 4098.50.
➡️
hour 1 minute 34 what is permissible
When we trade up into that volume imbalance, we want to see it respect the level and repel price. So when that candle closes and the next one opens, we’re looking for no return to where liquidity was removed. It could go back up and test that volume imbalance again, which is fine, but going above the high is not permissible. This is how barriers are built. How do you trust the ICT to lead the market where you expect, and how do you know it won’t just run past your target? That’s exactly what I’m teaching here.
hour 1 m35 really important
➡️
This turning point is confirmed when this candle fails to make a higher high or even touch back into the volume imbalance. When this candle’s low is taken out, I expect speed and distance in the move—essentially a sharp drop.
➡️
When the market pierces this low, that would be my original entry. If it had traded up into that fair value gap, I would have added more contracts.
Yes, you would frame this as a fair value gap, but you don't know when this candle will open or close, creating the volume imbalance. In my approach, I use the volume imbalance on this candle—if it opens here, as soon as it rallies into the range between this candle’s open and close, while the candle is still bullish, I sell short.
➡️
I'm framing the logic like this: I would enter on this volume imbalance as soon as price enters it. If the volume imbalance weren’t there, I’d be taking the trade in this SIBI, so I put in my largest position initially—say, six contracts. Then, in this next area, I’d add three contracts, cutting the original position size in half.
As the market breaks below these lows with strong energy and retraces, I want to see the wick immediately overlap. This is because wicks and midpoints of gaps can act as support and resistance. I don’t want the candle to open, dip, flirt with the midpoint, and then rally back above—it would be happening below old lows and could retrace unexpectedly.
Had that occurred, I might add one contract, but there’s risk of being stopped out. Experience teaches you that while you can’t know for certain, repeated logic usually works most of the time.
In this case, the candle opens, delivers the entire range, closes lower with a lower low, and everything aligns. We then open down here, have a volume imbalance, trade lower, and retrace to the midpoint of that gap, respecting consequent encouragement.
➡️
hour 1 minute 51 very important about Balanced Price Ranges - a must watch!
Consequent encouragement of the wick—that’s where algorithmic Smart Money, the composite man, engages. We don’t need price to come all the way back up here. This candle drives down into the low, and the next one opens higher, delivering once more over that range. What forms is a balanced price range—first the larger one, then a smaller balanced price range nested inside it.
Price doesn’t need to revisit the prior area; it trades lower, then climbs back over it again. Once it leaves that range and comes back, what’s permissible? A move to halfway. Halfway, marked by the wick, is also consequent encouragement, and that’s where several factors converge.
When I’m watching price, my eyes are scanning all of this in real time, pulling meaning from each candle.
The market trades back up to what? Consequent encouragement. That now becomes the high end of the new balanced price range, because price has already retraced that far. There’s no need to keep worrying about this old low or the prior area—it’s already done its work moving back and forth between those two candles.
Think about the paint analogy: are you going to paint the same spot on the wall five times? No—you’d just be wasting paint. Likewise, price won’t waste time. Time is precious in the market; it only has so many trading hours in a day.
That’s why your focus has to be disciplined. You don’t want to get lost in this while price is live, or you’ll miss what matters. But when reviewing price action, you do want to notice and reference these dynamics so you know exactly what’s unfolding.
Here’s the mean threshold for 4097.50. That’s the level price could reasonably trade to—and it’s permissible, meaning it’s allowed and wouldn’t disrupt the structure.
But the market fails to reach it. Instead, it trades below that prior low. That expands the range and breaks it lower. At that point, there’s no need to go back up to the mean threshold—we shift our focus to any further downside continuation.
So what does the area between the untouched mean threshold and the new low become?
It forms the new balanced price range.
From here, the question is whether the market wants to trade away from that range. And yes—it does. But notice the time: 15:24 New York local time. Late in the session, price often becomes aggressive, seeking out the day’s remaining liquidity. That’s exactly what happens—it runs hard and aggressively pursues those pools.
➡️
It hits that level at 15:34—34 minutes after three. Then, by about 20 minutes to four, you want to be sitting and waiting for price to make a run on liquidity.
Why? Because if price has already shown its hand within the first 15 minutes of that move, the next phase is usually a more aggressive run toward liquidity that hasn’t yet been touched.
In this case, the untapped pool was the buy-side liquidity I had already pointed out. And sure enough—that’s where it went.
After that, we’re in a time of day where the market tends to flatten out. It trades listlessly between the high and the low, simply because it hasn’t hit the 5 o’clock close yet. Retail traders often get chopped up trying to trade in that noise. But all that’s really happened is this:
- A low was created.
- Price rallied off that low.
- The same macro sequence repeats, again and again.
The key lesson here is reading price through the lens of order flow. Every time price overlaps a prior candle’s range, it tells a story:
- If sell-side is offered, the market is leaning lower—it’s a down candle.
- If you’re bearish, you want that down-close candle to be redelivered with a temporary up move, then resume lower.
It doesn’t even need a full up-close candle. For example:
- Say you have a down-close candle.
- The next candle opens, trades higher, overlaps the range, then sells off to a lower low.
That wick alone is enough—it shows the market offered both sides.
Efficient delivery means the run between two price points must offer movement in both directions. Whether the sequence is down → up or up → down, both must be present, and the overlap of ranges confirms it.
That’s the framework I just walked you through in this sequence.
➡️
If the market trades back and forth between defined price points and delivers both directions, that’s what we call efficiently delivered price.
But when it fails to do that, you’ll see imbalances—like when one candle’s low and the next candle’s high don’t overlap. That’s where we get a Fair Value Gap (FVG).
👉 A Fair Value Gap is always a three-candle structure:
- The first candle
- The middle candle (this one creates the inefficiency)
- The third candle
The gap itself is the range between the first and third candle that wasn’t traded through by the middle candle.
Now, just because you spot a Fair Value Gap doesn’t mean it’s automatically a trade. For example, in this sequence, price trades up into an FVG late in the day. Is that a short?
No. And here’s why:
- It’s already been trending lower all day.
- You don’t want to initiate fresh shorts 11 minutes before the 4pm close.
- Fading late-day reversals is a recipe for trouble because the market often ramps against those shorts.
Why does it ramp? Because the algorithm (composite man, smart money) uses that order flow to induce short covering. That covering provides liquidity for them to execute the other side of business.
And remember—it’s not just speculative traders in the market. There’s real commercial order flow coming in.
For example, in currencies, big windows like the London Close (10am–12pm New York time) bring in significant flows from banks and institutions. That flow often drives short covering or long liquidation, which the algorithm uses to balance books and facilitate actual commerce—not just speculation.
So the big takeaway:
- Fair Value Gap = inefficiency.
- It marks an important reference, but context and timing matter more than just spotting the gap.
Keep learning with us.
Get new ICT lessons, study notes and updates as we build V2.