
Part 2 \ How To Probe Low Probability RTH Opening Ranges 07/14/2026
Then I said the whole, the whole range to the downside, because we're probing low probability opening range. So what does that mean? How far can it go?
Date: 2026-07-14
URL: https://youtu.be/bz4QNPcpmWE?si=WbIGmikQhaKh46o0
Yesterday I was giving my son a lecture on probing a low-probability opening range.
And the opening range yesterday was just ahead of today, where we have the CPI number at 8:30 Eastern Time, and we’re just a little under an hour away from that occurring.
But let’s go out to a daily chart real quick, because I had a few people on X and in the comment section of yesterday’s video.
I talked about how this area was my immediate focus.
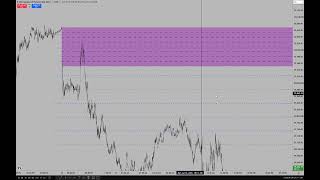
Then I said the whole, the whole range to the downside, because we're probing low probability opening range. So what does that mean? How far can it go?
Now, I understand some of you are looking at this and saying, well, you know, if you click the SET here, it’ll do this and do that.
The close being 31.25, open 37.75, there is a volume imbalance there.
But price was already below that yesterday when we were looking at price.
So if I’m looking for how far it can drop down, it’s not warranted to concern ourselves with the upper volume imbalance.
It’s not pertinent to what I was disclosing yesterday.
So I mentioned this one down here.
I want to bring it to your attention that it wasn’t that I was incorrectly annotating it.
You’re not paying attention to what I was saying in the lecture yesterday.
How far can it go down?
How far can it go?
Okay, and when we drop back down into a 1-minute timeframe, we’ll go to the 13th and we’ll do 9:30 a.m.
We’re going back through old price action.
And by going to the left, that’s okay.
Look at this.
Look how obvious that is.
Now what you’re learning this morning is why I chose those relative equal lows.
What are those relative equal lows inside of?
Oh, the daily chart’s volume imbalance, the low end where I said, how far can it probe lower?
Go back and watch yesterday’s video, folks.
If you’re here to learn, I’m telling you what to do. I’m telling you how to find it.
Okay, now I’m going to refine that today rather succinctly.
So we have these relative equal lows.
I like them because I already knew that the volume imbalance agreed with this.
So now what am I saying?
What am I teaching?
When I like to go back through old data to the left and determine where a higher low may form for the day or the session—either/or—what I’m looking for is some higher-timeframe key level.
Now, that may be a weekly. It may be a daily.
Predominantly, it’s going to be a daily.
I’ve said this ad nauseam: unless you have a daily chart perspective, you don’t have the highest degree of probability in your favor.
So by knowing where these things occur and form—and I mentioned them yesterday—the apt pupil would have already determined, because of that volume imbalance that I was indicating in yesterday’s lecture with Caleb, that you should have it on your chart, and you’ll see why this agrees.
We have a low here, we have relative equal lows here, and we have this swing low here.
But I wanted this one.
Why?
Because it’s the first one dropping down from where we were at 9:30.
If we go to regular trading hours, look at this.
Crazy-level stuff.
All right, so here is the low.
Now, if you go watch yesterday’s video, which I uploaded well before your daily chart completed, there’s your low of the day.
So this business of trading down here—and then go back and listen—I said it can go down there, knock those out, then it could come back up into Monday’s opening range gap, the Regular Trading Hours Opening Range Gap.
So this is how we settled the regular trading hours session.
And if we go into electronic trading hours, it did, in fact, go lower than that.
Here’s where we went into it here again.
There's the low at regular trading hours. We swiped below it one more time, came back up.
Then it rallied up and took out the relative equal highs here.
Then, at the peak of Asia last night, we sold off again, went back down through that volume imbalance in yellow, and then swept that low there.
Then we rallied back through that volume imbalance.
Midnight. Midnight.
Watch, folks, watch.
If you look at the midnight candle right there, okay, there’s the open.
There you go.
Now, if you want to trade London, nice little opportunity.
Trades lower, back down into a breaker.
What’s this?
Low, high, lower low.
No volume profile required. No footprint required.
Very easy.
It took liquidity, we rallied up, retracement into an order block there.
Let me draw it for you.
Change in the state of delivery is the open.
Beautiful.
Rallies away, comes back down into a breaker.
Low, high, lower low.
Here’s your breaker.
And then it has a fair value gap at the same location that the breaker forms.
Beautiful.
That’s another Unicorn.
Super strong.
Super, super strong rally.
You want to see, does it show willingness to go higher?
Then we create a little fair value gap in here.
Wouldn’t you know it?
Expect higher prices.
We have relative equal highs here.
Now, if you were just a small-time scalper and you didn’t have any expectation of a rally higher up, then you could simply take that high here and be content with that.
Or you could look for a higher price run in the direction of what I mentioned yesterday.
Here is the Opening Range Gap low for Monday.
That’s yesterday’s 9:30 a.m. Eastern Time opening price.
Notice how we’ve gravitated from all this.
We consolidated in here, and squaring positions ahead of CPI is warranted.
It doesn’t matter if I’m right and it goes all the way up and closes in on the high of yesterday’s Opening Range Gap, or trades to the New Week Opening Gap, which is what this is up here.
That’s all New Week Opening Gap.
It doesn’t matter because, you know, $14,000, $13,000, $15,000—it is what it is.
Okay, sleeping overnight, waking up, making that kind of bread?
Yeah, that’s a good thing.
Risking it on the heels of a day that we anticipated certain characteristics about being low probability.
And you can see, we didn’t really do too much in regard to trading into the gap.
Here’s the open at 9:30.
We went up, hit the lowest octant in the Opening Range Gap.
There, and that was it.
We went lower and traded down to that lower volume imbalance during the regular trading hours portion of the session.
Then overnight, when we resumed trading post-4:15 Eastern Time and electronic trading hours came back in, we went lower.
We went lower here and took out a low.
And then we have a market structure shift here.
So now gravitate back toward what?
Yesterday’s Opening Range Gap.
That’s the low here. That’s the 9:30 opening price there.
So what we’ve seen overnight is the ability for price to want to gravitate up toward that Opening Range Gap again.
And then we want to see if it can now make an attempt to get up to the consequent quarter of it.
So that’ll be around 29,881.5, okay, right there.
And then to the upper half of it, and then maybe explore into the New Week Opening Gap, which you can see over here.
There’s the New Week Opening Gap, which we came back up into.
Notice it didn’t do a full gap closure. That’s why it was decidedly weak Sunday night.
Sold off sell-side here.
So I’m looking for price to basically get up into these areas today, as I mentioned yesterday.
And if it can’t do it today, I expect it to do it tomorrow on the PPI number.
Okay, I will not be participating.
My advice is, if you’re in something, your stop-loss isn’t going to save you.
And it’s still a gamble, you know.
I could be wrong.
I could be wrong about where price is likely to go.
I believe it’s going to go higher because we have unfinished business up here with yesterday’s Regular Trading Hours Opening Range Gap, and we have the New Week Opening Gap that didn’t fully close.
So I just don’t think it warrants the risk associated with holding something ahead of CPI or PPI.
Because if you’re wrong, your open profit that’s unrealized could evaporate immediately and then put you into a net loss position.
They’re extreme price runs.
They tend to be, let’s put it that way.
I’ve seen a few where they’re kind of lackluster and didn’t do anything, but it’s not worth the risk and gamble.
If you have something open in profit, this is not the last trading day of your career, okay?
If you catch a move up into these levels and you’re long, that’s wonderful.
I’m not going to high-five you or congratulate you or like your post because I’m telling you that that is not sound behavior.
That’s not what a very good risk manager does.
They stay out of the harmful likelihood of things like these reports, just like Non-Farm Payroll.
You’ve got to manage risk impeccably, and managing risk impeccably does not entail trading CPI and PPI numbers.
Okay, so I wish you all a very pleasant day today.
And be careful if you’re out there recklessly plunging ahead.
And if you hurt yourself, remember I told you so.
Keep learning with us.
Get new ICT lessons, study notes and updates as we build V2.