
NQ Futures Trade Review - July 20, 2026
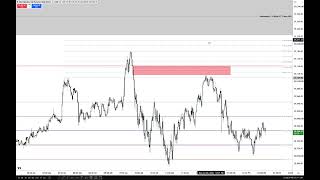
All right, so this is the Nasdaq daily chart.
Date: 2026-07-20
URL: https://youtu.be/2L88yH3LKcs?si=8lVzitSc6gpFtchp
Loading post from X…
A preserved copy is ready if the original cannot load.
Loading post from X…
A preserved copy is ready if the original cannot load.
Loading post from X…
A preserved copy is ready if the original cannot load.
Loading post from X…
A preserved copy is ready if the original cannot load.
Loading post from X…
A preserved copy is ready if the original cannot load.
Loading post from X…
A preserved copy is ready if the original cannot load.
All right, folks, welcome back.
All right, so this is the Nasdaq daily chart.
And if you see this wick, we were concerned about it going down and making a meaningful run below its consequent encroachment, or midpoint, in here.
So since we went below it, obviously this is going to be a factor for price on the upside.
So we’re just going to take these lines off and focus on the consequent encroachment level.
You know that is this discount wick become premium array.
We did clear out the relative equal lows we were aiming for last week, and a little bit of a giveback is reasonable.
The immediate rebalance will be to this low and consequent encroachment of that daily chart wick.
Let’s go into an hourly chart.
This buy-side imbalance, sell-side inefficiency from last week sent price lower.
And then we’ve got to go into a 1-minute timeframe.
I’ll show you the business.
So price climbed overnight, reaching back toward that 1-hour buy-side imbalance, sell-side inefficiency.
And when we opened at 9:30, right there, we ran above relative equal highs and toward that buy-side imbalance, sell-side inefficiency on the hourly chart.
Admittedly, as I outlined in the pre-market session, I wanted to see it drop down and take buy-side, then trade into the Regular Trading Hours Opening Range Gap consequent encroachment level in here, and they chose to Judas swing it first.
This Fib up here is anchored to this high.
Drag the Fib up to below the hourly buy-side imbalance, sell-side inefficiency.
I indicated that the halfway point in here is between this high and the low of the buy-side imbalance, sell-side inefficiency.
So it’s the hourly chart.
See that right up here?
So when price went above these relative equal highs, how high can it go, Michael?
Well, between that high and the low of the buy-side imbalance, sell-side inefficiency.
Why am I even referring to that?
Because it’s the most salient specific price level on the hourly chart that stands out going to the left.
And we went through it last week, so it’s reasonable, as I gave guidance in the pre-market session, that I wanted to see it drop down, take sell-side, and then run up there.
And then I would have gone short using this area up in here.
But because it just started right out of the gate at 9:30, right there, that’s a Judas swing.
It took out buy-side.
We gapped higher.
The 9:30 opening is right there.
That’s the opening price.
That’s the Regular Trading Hours Opening Range Gap high.
Why is it the high?
Because we settled down here during regular trading hours.
Toggle back to regular trading hours.
On Friday, right here.
And here’s the opening at 9:30 Eastern Time for the regular trading hours restart for Monday’s trading.
So that’s your gap.
Consequent encroachment is here.
We traded down into that.
It didn’t get there by 10 o’clock.
The first time it reached it was 10:55.
That’s okay.
Then we traded all the way back up.
So when price went to consequent encroachment of the gap between the old high here and the low of the hourly buy-side imbalance, sell-side inefficiency, it traded to a high here.
Look at this candlestick’s high: 29,167.25.
Look at that price.
So we essentially hit it, came back down lower, and rallied one more time.
But notice, the first time it hit consequent encroachment—that’s this level right here—the bodies couldn’t touch it.
It was just the wick.
And then we ran right through it here, got to this octant here, 0.375, and failed to touch the upper quadrant.
So there are three things happening here.
The bodies can’t touch consequent encroachment.
It breaks lower, then it runs through these highs.
This is engineered buy-side liquidity.
That’s why you watched me shorting it when we went above here.
And I’m trying to short it anywhere between the upper quadrant level and the low of the 1-hour BISI.
So I’m measuring some range that nobody else would have been paying any mind to.
There’s no other school of thought that’s going to be focused on this bit of price action.
No one else is looking at that, not in the way or in the context I’m giving you here.
So if I’m going to concern myself with this old high and this buy-side imbalance, sell-side inefficiency from last Wednesday’s hourly chart…
If I think it’s going to fail to get there, well, I want to see it create a short-term high and give me evidence around consequent encroachment.
Because if it’s bearish, the upper half right here is going to stay heavy.
And below it, it’s okay to see bodies left in there.
But if we create a short-term high, then I’m expecting this to be a Turtle Soup false breakout run on engineered liquidity.
So they ran right from 9:30, right there on that candlestick, straight from the open.
Straight up to the short-term high, ran it, then broke down.
Well, with that, what I was looking at is we went above a short-term high right off of a Judas swing, which is one-directional right at the 9:30 opening, the beginning of regular trading hours.
And we’re getting the evidence that the bodies can’t touch consequent encroachment.
We ran through.
So if you’re struggling with, “Well, what about this? There are bodies in the upper half, right?”
It has to have bodies up there if it’s going to run this high out.
Think about it.
I want to see buy-side engineered and then run out, but still keep the same signatures with the order flow concepts that I teach, where the candlestick body isn’t touching the consequent encroachment between here and here.
This is event horizon.
It’s the midpoint between two key PD arrays.
It rallies up, and the bodies can’t even touch the upper octant at 0.375.
And then the high here can’t even touch the upper quadrant.
So, failure to touch there, failure to leave a body touching it there, and failure to put a body at consequent encroachment, and then running buy-side there right off the 9:30 opening, which is just straight parabolically going higher when we gapped higher.
And mid-gap is down here—consequent encroachment, the Regular Trading Hours Opening Range Gap midpoint, right there.
So because we’re taking buy-side here, because it was a straight shot, and because we’re failing at levels that are key to determining that this has probably run its course—now, what happens if it kept going higher?
Then I would have stopped out.
That would be a losing trade.
How’s that for logic?
So you’re afraid of that.
I’m looking at all the things that are suggesting it shouldn’t be doing that.
It shouldn’t do it because all things are indicating that it’s just trying to get people chasing price higher.
Now price breaks below that short-term low here, and then we have the market open trade up into consequent encroachment of this sell-side imbalance, buy-side inefficiency, then it breaks aggressively lower.
https://youtu.be/2L88yH3LKcs?t=975
I like these relative equal lows initially, and then this one here.
So I had a limit order resting there, and then I changed it down to here.
And then I wanted to see it reach down into consequent encroachment of the Regular Trading Hours Opening Range Gap.
So, first bit of business, I’ll zoom in so you can see it.
Really take in where I’m entering.
And because of the logic I’ve been teaching ongoing, this is real order flow, algorithmic order flow that cannot hide from you.
You can see it visually represented in the candlesticks.
Okay, that’s why you should not be looking at anything that’s modifying the open, high, low, and close.
If you have anything like range bars or some kind of concoction that you want to present as a supposed algorithm—no.
The bodies are not touching consequent encroachment.
The wick can, but the wicks are allowed to do damage.
The narrative and volume are really shown in the bodies.
Then it rallies up, and the bodies can’t even lay on this octant, and then the wick can’t even touch the upper quadrant.
So with an X-ray view, seeing price like this, we’re seeing them heavily distribute into this run.
So Smart Money can go long here, sell, and sell more into the engineered liquidity that forms when this starts to break down.
People like to see that and say, “Oh wow, it’s going to start selling off, and maybe it might run for those relative equal lows right here.”
They put a stop-loss right above that, and then the market rallies higher—not because of buying pressure, but because the algorithm will see this high and simply reprice up there.
It doesn’t matter how many contracts fill up here.
Not every contract that had an order here was filled.
Just because there’s an old high here doesn’t mean every contract with an interest to buy or sell there gets filled.
The algorithm is not trying to make sure everybody gets a fill.
The algorithm is simply presenting the opportunity for Smart Money to ride this rigged game.
So because I have a little bit of experience and I know what I’m looking at, I recognize my algorithm, and it’s me selling short right here.
All in this vicinity, right where Smart Money is going to want to try to accumulate.
So I’m in there doing an amazing feat of precision.
And I’m not trying to be facetious or funny—this is the facts.
Getting short, and I’m going to be aiming initially right below these lows here.
https://youtu.be/2L88yH3LKcs?t=1243
So there was a breaker here—high, low, higher high.
This is your breaker.
Okay, if it’s a good, valid breaker, you wouldn’t want to see the bodies trade up outside of it, and it doesn’t do that.
The market breaks, there’s a shift in market structure, then we trade up to this volume imbalance high.
That candlestick’s open—we open, trade right up into that beautiful, beautiful delivery, and immediately fold and go lower.
And what could have potentially been a bullish fair value gap turned inversion fair value gap, it just wilted right through that.
So that was giving me the confidence that right below these lows was not enough.
I could put a limit order to take something out below that.
Eventually, it did in fact go down into consequent encroachment of the Regular Trading Hours Opening Range Gap.
It rallied up, the order block changed the state of delivery here, and price hit it.
And then we’re using an octant, which is the 0.375 level, in agreement with an order block right here.
Rallies up, consolidates, and then sends it right back up to this gap.
Touches it right there.
Does it leave a little body in there?
No.
Is that bullish?
No, it’s bearish.
So where’s liquidity at?
Resting right below these relative equal lows here.
So we could anticipate a run into that for the lunch macro.
Smoked.
Look at that.
Then we have another sell-side imbalance, buy-side inefficiency, and to the left of it we have a wick.
Okay, so let’s measure that.
Here to there.
So we want to see the inability to keep price above it with the bodies.
Here we have a body there, but immediately, look what happens.
It opens and then gives up the ghost very, very quickly.
For a non-news-driven market environment today, that’s pretty handsome distribution of shorts into a market that looked bullish to the public.
And then taking logical levels here to get out, then getting stopped out on the balance, then going to my target, which is fine.
You know, in the last, I guess, year, I’ve seen a lot of this type of stuff happening.
And also, a lot of my students are taking note that they’re understanding more and more why I don’t sit out here and give you entries and stop losses, because I’m the largest one in the industry right now when it comes to this kind of stuff.
We have these lows here, and I still think that these are potentially available.
So let me address it like this.
Okay, so that’s still on my radar.
Just like I think that the relative equal highs on the Nasdaq are potentially a target on the upside.
So I really favor it going down to go up.
That’s kind of what I’m getting at.
I wanted to see it do it this morning, where it would have gone down first, then I would have targeted the 1-hour BISI, and then I would have shorted somewhere up here.
But you’ve got to trade what they give you, right?
And if it’s going to be a straight-line shot right out of the opening range at 9:30 here, when I’m already opening with a gap—so this is where we opened, and this is where we settled last Friday during regular trading hours—that’s a big, formidable gap.
So if we’re running right from the opening at 9:30, chances are it’s going to run out of steam somewhere, and you have to know the technical science. I say that with tongue in cheek.
You have to know where they’re likely to peter out, and there’s no necessity for looking at any kind of tools outside of what I’m showing you here.
What’s so hard about this?
Old high with relative equal highs and a 60-minute buy-side imbalance, sell-side inefficiency where it could draw to.
That was mentioned in my pre-market analysis.
Like I wanted to see it drop down first to go long.
That would be where I would sell short.
I would sell my longs and reverse there.
But the market’s being very, very fickle right now, so I had to earn it this morning.
This was not as easy as I make it look.
But I was kind of regretting that I showed my stop-loss publicly.
I get folks all the time saying that I cherry-picked out of, you know, half a dozen laptops or whatnot.
And you can literally see in the recording that I’m recording only one screen.
I’m not doing other screens.
I’m constantly staying busy on this one.
And it would be very, very hard for someone to manage what they say I do and be able to be this precise with it.
Loading post from X…
A preserved copy is ready if the original cannot load.
Loading post from X…
A preserved copy is ready if the original cannot load.
Loading post from X…
A preserved copy is ready if the original cannot load.
Loading post from X…
A preserved copy is ready if the original cannot load.
Loading post from X…
A preserved copy is ready if the original cannot load.
Loading post from X…
A preserved copy is ready if the original cannot load.
Loading post from X…
A preserved copy is ready if the original cannot load.
Loading post from X…
A preserved copy is ready if the original cannot load.
Loading post from X…
A preserved copy is ready if the original cannot load.
Keep learning with us.
Get new ICT lessons, study notes and updates as we build V2.