
Market Review NQ July 31, 2026
Pre-market dealing-range projections, NDOG and daily volume-imbalance confluence frame an intraday high, while one-second price action refines short execution toward sell-side liquidity.
Date: 2026-07-31
Loading post from X…
A preserved copy is ready if the original cannot load.
Loading post from X…
A preserved copy is ready if the original cannot load.
Loading post from X…
A preserved copy is ready if the original cannot load.
Loading post from X…
A preserved copy is ready if the original cannot load.
Loading post from X…
A preserved copy is ready if the original cannot load.
Loading post from X…
A preserved copy is ready if the original cannot load.
Loading post from X…
A preserved copy is ready if the original cannot load.
[00:00] Hello, folks. How are you?
We're just going to do a quick review, and I promise I'll keep it as short and painless as possible.
I don't know if I'll be able to come back later this evening, but if I can, I will. If not, I'll try to do something very early tomorrow morning—something along the lines of a Shotgun Saturday.
That's basically just me talking. I won't be showing any charts or anything like that.
[01:26] This is the daily chart.
Before the market even opened on Sunday, I said price would rally into Friday's volume imbalance from the previous week, then trade lower. That's exactly what happened.
After the FOMC, the market rallied all the way back up and found its way right back into that same volume imbalance. So the weekly low was, in fact, in place, just as I suggested it probably was. From there, we had a follow-through rally that essentially brought us back to where we started the week.
[02:14] I still don't know how we're going to close the week, so I need to see where today's close ends up—both technically and in terms of how we leave the various liquidity pools.
It's still a little early. Right now it's 1:00 p.m. Eastern Time, so we have a couple more hours before the weekly settlement. We'll see how that develops.
Anyway, that's the broader picture. Now I'm going to add the annotations back onto the chart, and then we'll drop down to the 1-minute time frame.
All right, I'm going to revisit an idea I've taught before. I originally covered this when I was teaching Forex, but it's something I was already using as an S&P futures trader back in the 1990s.
When you truly understand market structure, the range price is trading in, and how to properly apply the PD Arrays I've introduced to the trading community, this methodology becomes very powerful. It's not enough to simply think something looks like a Fair Value Gap or an Order Block. There has to be technical criteria supporting it.
[03:39] That support comes from the gradients—the octants, the quadrants, and eventually one more level of division. But not yet. Don't worry... Christmas is coming.
Now look at this strong rally. Because price moved higher so quickly, let's compress the chart for a moment.
Everything you're seeing here was already given to you in last night's review. Look at it. It's brilliant. Price rallies, gives us one, two, three, then a failure swing before dropping back down and clearing the liquidity here.
[04:27] In my mind, I thought it would be fairly easy for price to come back down and run below 28,400.
I was watching that during the pre-market session, so I tweeted that it was on my radar. Specifically, I was referring to these two lows right here.
Let's zoom in.
We have this low here that was used with this older inefficiency. The buy-side imbalance, sell-side inefficiency had already reclaimed its first utilization.
[05:08] First utilization is simply my way of describing how a PD Array was first presented in price action.
For example, if it's an up-close candle that creates an inefficiency, its first utilization is as a Bullish Fair Value Gap. That doesn't mean price will automatically rally just because it trades back into it.
You still have to know where you believe the market is drawing to. Nothing about this removes that responsibility. There is no shortcut.
[05:40] You have to spend time studying and applying these concepts. Over time, you'll begin to understand them.
But look at how clean those lows are.
[05:40] I mean, look at that. It's obvious, right?
Not like this. This. So it left that there like that.
That's what caught my attention this morning. So I tweeted that 28,400 sell-side was on my radar.
In other words, after the 9:30 open, all of my focus was going to be on this area.
Now that we've identified that level, we can come back over here.
[06:17] Now, here's a little bit of wizardry.
This level should look familiar because we used it last week.
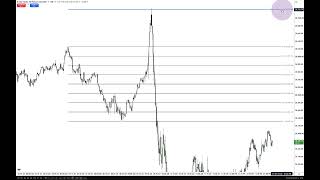
We have this range low and range high before the rally. Together, they define the pre-market dealing range—the two-hour window from 7:00 a.m. to 9:00 a.m. Eastern Time.
That pre-market range gives you everything you need to evaluate the opening session. At a minimum, it helps you understand the Opening Range and the first hour's dealing range.
[06:59] From 9:30 a.m. to 10:30 a.m. Eastern Time, you're going to derive information that most retail traders never even know exists. They don't know how to read the market the way I'm about to show you.
We have this range high and this range low. Now watch.
Let's remove the annotations for a moment so we're left with nothing but this range. If I take a Fibonacci tool and measure from the low up to the high...
[08:11] ...look what just happened. Where did that come from?
If you've been studying with me, you already know I've taught specific range projections and how to derive standard deviations from an Opening Range Gap or a dealing range.
I introduced several of those projection levels, but the first one I taught was the 0.5 projection.
In other words, you take half of the range you're measuring and project it beyond the range. So what does that tell us?
[08:56] When I'm looking for the daily highs and lows, or even session highs and lows, this is the projection I use.
The Fibonacci is anchored to this low because it's the lowest low of the pre-market session—the two-hour window from 7:00 a.m. to 9:00 a.m. Eastern Time.
Now, about this blue line. I want to explain it so I can remove it.
[10:45] It's simply the high of the daily Suspension Block—the blue-shaded area we've been following since last week.
I was using it as a measuring stick to see how quickly price would get back into that range. Did it have the willingness to drill back into it?
Given these lows here, that was a reasonable expectation. We were also watching 28,400, which is exactly what this level represents—the relative equal lows just to the left.
All right, now I can remove the blue line because I don't need it anymore.
[11:17] We've already accomplished the purpose of marking the high and low while price was moving higher.
It's the same thing I've been teaching all along: time and price grids.
What time is this low? 9:00 a.m.
Isn't that part of the 8:50–9:10 macro?
Now, why is this Fair Value Gap valid?
Because it's anchored to the lowest octant of this dealing range—from here to here.
[11:59] "Why didn't you use this range back here, ICT?"
Because that's not the session I teach you to focus on.
I start at 7:00 a.m.
So I measure from the highest high formed between 7:00 a.m. and 9:00 a.m. Eastern Time down to the lowest low, which formed here at 8:44.
That two-hour window defines the time component of the grid. The price levels become the horizontal references.
[12:39] These are the keys to the kingdom of the market, baby. That's what this is.
They're never, ever, ever going to be able to hide this from you. No matter where you are in the world, we all have the same thing—we have time. As long as your clock is set correctly, you know what time it is.
And the time that matters is always New York local time. I don't care what anybody else tells you. I promise you, that's the way it is.
[13:11] This is the time portion of the grid. So where do you frame it from? The highest high and the lowest low.
So now, inside this small area, look at what's happening.
We have a sell-side imbalance, buy-side inefficiency. Price trades back up into it here, and it aligns with this key level. That's why you can sell short there.
It's a valid SIBI. (before the session low is printed? ICT said that he explained later on)
Loading post from X…
A preserved copy is ready if the original cannot load.
I could still be keeping all of this under wraps. And this still isn't my best. It's not even close.
[14:34] We haven't even reached 20% yet. We're only hovering around 15.5–16% of everything I know.
Isn't that interesting? It makes life a lot more enjoyable when you know there's no shortage of dough with this baker.
[17:34] The macro, 8:50 to 9:10. Price rips higher.
This should act as a Breakaway Gap, and it does. Price can’t trade back down into it and continues rallying.
Now here’s a caveat. If you see a Suspension Block or a Volume Imbalance, you have to pay attention to the candlestick that creates the Volume Imbalance. For example, this is the low of this candlestick here.
[17:58] This is a buy-side imbalance, sell-side inefficiency. There’s a small gap in there, but if there’s also a Volume Imbalance, you can’t simply use this candlestick to touch the octant or key level. You have to refer to the candlestick that allows the Volume Imbalance to exist.
See that detail right there? Look at it. This candlestick tells you that the gap is valid. If price trades back down into it, that’s an Institutional Order Flow Entry Drill.
And look how much energy it gives you.
Buy-side imbalance, sell-side inefficiency. Why? Because it’s touching the Consequent Encroachment level, which is the midpoint.
Midpoint of what? The range from the high down to the low during the pre-market session.
So this should act as what? A Measuring Gap.
It should measure a continuous run up toward the old high.
Price can keep going higher, but remember, once it breaches the 50% level, we have a measurement suggesting it’s likely to continue higher.
[19:13] So if price takes out this high and we apply the projection I just showed you with the Fib, calling for 28,723 even—we’ll get to that in a moment—this is telling me we’re halfway there.
Then we get this buy-side imbalance, sell-side inefficiency.
There’s a Volume Imbalance at the high, but no Volume Imbalance at the low, so we don’t need to worry about selecting a different candlestick to the left. This is the candle we use.
So we have a Bullish Fair Value Gap here. Price trades down into it, then trades higher.
[19:49] Same bit of business here.
There’s your candle and Fair Value Gap right before the opening. Price runs, rips higher, and blows right through this high.
We were watching that, and I was telling my sons, “I think we’re going to trade up into that Volume Imbalance from last Friday.” That’s the same Volume Imbalance that started the week, where I told you—before the week even began—that price was going to trade up into it and then sell off as a swing trade idea.
[20:24] I gave that publicly during the Trader Roundup X Space with Kit and company, so you can still go back and listen to it. I also took a snippet from it and posted it on my Twitter.
Loading post from X…
A preserved copy is ready if the original cannot load.
Loading post from X…
A preserved copy is ready if the original cannot load.
20:40] So here we have price ripping higher, and we have our projected high. Why should this be a projected high? Why can I go in there looking to sell short?
Because we’re above this level.
[21:02] We have buy-side liquidity layered into last Friday’s New Day Opening Gap. This also shares the same spatial range as the daily Volume Imbalance I showed you on the daily chart before we dropped down to the 1-minute chart. This is that same range.
So as price moves toward this level and trades up into this area, I’m going to hammer it. I’m going to sell right into it.
And I know some of you are asking, “How do you know?”
[21:33] Experience. And I can’t give you that. You can’t purchase it from me or anyone else.
[22:05] See, I love keeping you in a state of new discovery, but I’m not holding you back. I’m allowing you to grow at a healthy rate so you can understand more and more as you progress.
Some of you already think it’s too much information. It’s overload. I see my students saying that all the time. No, it’s not too much. It’s just too much to swallow all at once. You have to take a bite and chew it slowly. That’s how you devour the elephant, and that’s exactly how I learned all of this.
[22:35] You want it fast—fast and furious. But the only thing that’s going to happen is you’ll try to learn it fast, then you’ll be furious when it doesn’t work in your hands because you don’t have the experience.
You like that? I don’t know where this stuff comes from. It’s a gift.
Now, because price trades up into that New Day Opening Gap and reaches its Consequent Encroachment, once it hits that level, we want to see it aggressively rip lower.
[23:00] Now I can take the 9:30 opening price, right there. This has no bearing on what I’m about to show you. Then we’re going to go down to the Regular Trading Hours settlement price.
Here we have the Opening Range Gap, measured from the 9:30 opening price down to the 4:14 p.m. Eastern Time settlement price. I promise you, this is good information.
[25:25] Here’s Consequent Encroachment. By 10:00, there’s a 70% likelihood that price will trade back to that level. We get a quick, sudden rush lower, then price delivers the 70% move back to Consequent Encroachment.
We also have sell-side liquidity below here. As I tweeted earlier, 28,400 sell-side was on the radar.
[25:55] Again, that’s referring to these relative equal lows—this really smooth area right here. Even though the sell-side liquidity was there, I simply saw it and went with it.
Every now and then, I’ll give you a target that I believe is a viable draw for the Opening Range. During the morning session, when I give you a level like that, your job is to study how price behaves around it.
[26:20] I’m not giving you buy and sell signals. I’m not going to set you up like that. That’s what you want. You want to copy me.
So price trades through 28,400 and continues even lower, all the way back down to the Regular Trading Hours Opening Range Gap low, which is yesterday’s 4:14 p.m. Eastern Time settlement price.
It hammers that level. Look where the candle bodies are.
[27:12] Then price trades right back up to that liquidity pool I told you about. Isn’t that crazy?
The candle body stops right there.
[28:20] I already shared this on X. I recorded the video while I was talking to my sons, Caden and Caleb, and I explained to them what I expected to happen.
And the market delivered rather handsomely.
Loading post from X…
A preserved copy is ready if the original cannot load.
[30:41] Because we know where we’re looking for price to go. We have confidence in the model, and we have confidence in the algorithmic delivery of price action.
We’re not guessing, folks. Look at this, man. Seriously. Come on. You think that’s guessing?
Here, let me show you. What time is that? 9:35.
Let’s go down to a 1-second chart.
https://youtu.be/uws9egBxPLI?t=1920
[31:25] Okay, 1-second chart.
Whenever the chart populates and shows these tiny arrows stacked close together, you can’t really appreciate where the actual entries are. So I tossed one contract in because I was concerned price might jump up there before giving me another opportunity.
[32:20] When I say concerned, what I mean is that I wanted to make sure I had some exposure if momentum carried price into last Friday’s New Day Opening Gap. By putting one contract on, I also gave myself a direct link to the order flow. Now I had something in the race, and I could judge whether price action was supporting the idea from that entry.
If I think price is going higher toward 28,723, then I want to see the price action behave accordingly.
[32:50] Look at that stop right there. It’s almost like I’m the algo.
Look at the candle bodies. Really take this in, folks.
On a 1-second chart, I only have seconds to use market orders, so I’m reading price action in real time. I put one contract on because I wanted to be involved in case I was wrong about getting a better entry.
Price might not reach the exact level. It could simply get close to the NDOG and then give me something like an Inversion Fair Value Gap to short into.
[33:24] At least I tossed something in there. Now I’ve got something in the race.
I’m not worried about all of this because it’s small. I’m paying a premium to get intel and information. Then price hits my level right there and immediately starts giving me the feedback I’m looking for.
You may not see it, but I’m reading the 1-second chart. What is this? It’s a buy-side imbalance, sell-side inefficiency touching a key level. Why is it a key level?
Because it comes from that projection using the dealing range I showed you between 7:00 a.m. and 9:00 a.m.
[33:59] **-0.5. **Market wizardry.
Price breaks lower, forms an Inversion Fair Value Gap, then breaks again. Entry. Entry. Entry. Entry. I’m just tossing them in there.
And it’s all part of this final little run with one, two, three bodies.
Count the bodies, not the wicks. Each one of these is a swing high.
If you had just one entry anywhere up in this area and held for the sell-side liquidity pool I gave publicly on X…
[34:56] It takes a great deal of conviction to know what you’re looking for in here. When we’re testing for daily highs or lows, or session highs and lows, you’ll often see me toss in a single contract like I did down here.
When I’m doing that, I’m trying to get a read on how the market responds to that specific order. I’m not going to be fearful if it draws down on me. I want to see new PD Arrays form. Having something in the trade brings much more focus and interest than simply sitting there watching price. I can push the trade, get involved, and observe exactly what price does.
[35:38] It’s not the same as watching price by itself. When you have something to weigh and measure against—even if it’s only a demo trade—you become much more engaged with the delivery.
If you trade a live account or a prop firm account where profits can be withdrawn, keep a demo window open alongside it. If you get an unction that the market is about to do something, before taking the trade in your funded or live account, throw one contract on the demo. Throw in a micro and get a feel for what price is doing.
[36:17] You’ll know whether you’re onside or offside. And even if you’re offside, it gives you more information to read. Is price really reaching the best turning point?
Because if it does, once it gets there, that’s when I’m going to load the boat and start sending in the infantry—start selling short.
Again, these are all 1-second candlesticks, so you’re seeing the entire high and low unfold extremely quickly. You might look at this afterward and ask, “Why did you enter down here? Why did you get this fill down here?”
[36:49] Look at that fill near the low. You have one second. That’s it.
It’s not as easy as you think. If you’ve ever watched 1-second candlesticks, you know how quickly they move. You’re not going to capture every little fluctuation perfectly, but you’re getting information as it prints. You can see the real order flow taking place.
You don’t need footprint charts. You don’t need all that other stuff.
[37:16] All you need is open, high, low, and close on a time-based candlestick—or the traditional open, high, low, and close bars if your eyes can handle it.
I spent a lot of time in my youth looking at those. For a long time, I resisted candlesticks because I thought, “This is trash. Larry Williams doesn’t use that.”
You like that? How about that, Mr. Williams?
He said he preferred looking at open, high, low, and close, and I thought, “You know what? He said that, so I’m going to stick with it.”
[37:43] I ended up hurting my eyes because I was constantly squinting at the open, high, low, and close bars instead of simply using candlesticks.
END OF THE LESSON - EXECUTION STARTS AT: https://youtu.be/uws9egBxPLI?t=2281
Loading post from X…
A preserved copy is ready if the original cannot load.
Keep learning with us.
Get new ICT lessons, study notes and updates as we build V2.