
How To Probe Low Probability RTH Opening Ranges 07/13/2026
So I won’t be participating so much in the morning session. I’ll be looking for the PM session.
Date: 2026-07-13
URL: https://youtu.be/rtIcbG6twrI?si=ILlhL5z109B6eCDq
New week, we have CPI and PPI numbers on Tuesday and Wednesday, and a Fed Chairman speaking at 10 a.m. on both days as well.
So this is going to be absolutely insane volatility in the morning session.
The PM session is probably going to be the better, I guess, more discernible price run.
So I won’t be participating so much in the morning session. I’ll be looking for the PM session.
So I may provide some kind of a lecture around that.
Then on Thursday, we have medium-impact stuff that’s not all that great.
And we have Consumer Sentiment on Friday at 10 a.m.
So that rounds out this week, but it’s a heavy hitter in terms of news.
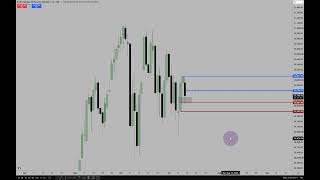
All right, so we have the daily chart.
I’ve stripped everything away and just want to get a fresh perspective on price.
For the folks who have been following along the last six or seven weeks in terms of the analysis I’ve shared from the daily perspective, we are inside this big range.
Okay, and what we have just done today, we’ve had a drop down in between the two wicks.
Now there's a volume imbalance at the low.
I’m going to change that to gray because I don’t want to imply a direction yet.
I’m still trying to flesh this out while we’re looking at it.
But we’ve done enough here to trade into a discount.
We have this wick to the left of us, so you always want to grade that, see if there’s a Fib on there, and just show the 50% level.
This is consequent encroachment of the previous day, or last Friday’s discount wick, but it could act simply as a premium array.
Any movement above this on a closing basis on this daily chart would warrant likely higher prices.
Next one would be consequent encroachment of this wick.
Okay, but we’re not going to do that now. We’re looking at just intraday charts.
So what does the economic calendar suggest for today, since there’s no news today?
Usually, no news can mean a quiet session, listless trading, lackluster price movement.
Other times, it could be rather stellar.
In this case, we have big news on Tuesday and Wednesday, so it’s a 50/50 whether or not we’re going to have a nice price run this morning, or everybody’s going to have to stand aside and let the volatility come in.
And then, once Wednesday’s done, we’ll probably see the cleanest price action from Wednesday PM to Friday’s close.
I don’t know what we’re going to see this morning, so I’m looking at the charts fresh.
I have not looked at the charts over the weekend. I have not paid any attention to Friday’s price action.
And with that, I just want to have a very, very clean slate so my perspective is not bringing in a preconceived idea or notion that the market should behave a certain way.
I like the fact that we’ve done this much of a retracement inside the BISI, within the wicks.
It has not fully closed in or filled in this suspension block.
That’s the actual perspective right there, but we’re going to use just the wicks because that’s enough to build an initial idea.
We’re going to drop down to a 15-minute timeframe.
All right, so we had a big New Week Opening Gap here, from where we closed on Friday to where we opened on Sunday, and we didn’t close that in entirely.
Okay, so here looks a little suspect.
Okay, they were able to swipe that.
Do we want to go look at that?
See how clean that is?
Yes.
So what I’m doing is I’m going through the chart, looking for where it is too smooth, too clean.
Now I want to see, do we have a willingness to go a little bit lower than this?
And if it does, we can trade to here.
So we did as much as trading down into that daily separation between the two wicks, but that’s not the fair value gap.
It’s just part of an imbalance.
So I’m looking at this wick here
and its consequent encroachment, the midpoint right there, and that’s what we just used.
See that?
And we suspect that we’re probably going to explore lower, but eventually work back up into that New Week Opening Gap and then get to the buy-side.
I’m trying to refrain from calling the high on the daily chart because they’re so rigged.
You know, the administration is trying to pad their buddies’ pockets, so it’s more rigged, more manipulated than usual.
So we had a sensitive reaction there at the low, that imbalance between the two wicks on the daily chart.
We also took this short-term low here.
We hit an order block, which is this down-close candle that was used over here as well.
We went a little bit deeper into it now, so we’re going to see, does it have the willingness to drop down in here?
And essentially what I’m saying is, I’m wanting more information from the opening range, the first 30 minutes.
So we’re going to drop down to a 1-minute timeframe with these levels in mind.
We have relative equal highs here, so we have minor buy-side there.
Why am I calling it minor buy-side?
Because we have a New Week Opening Gap from Sunday at 6 p.m. up here.
This is the more prominent buy-side, so this is minor because it’s lower than that.
See, in deference to where that is and where this is, this is minor.
It doesn’t mean you can’t find a good setup if it wants to run to that.
It just means that, by contrast, it’s not simply going to go up here and then it’s done.
It could potentially keep going back up to the New Week Opening Gap, which is why I’m thinking they’re going to try to visit that.
If not, they’ll get to it with the PPI or CPI numbers, that’s for certain.
It depends on what we see today.
So I’m trying to build an idea around what it may do.
I want to see higher prices.
That’s kind of like, if you were going to hold a gun to my head and say, all right, what do you think it’s going to do? Is it going to go higher or lower?
I think it’s going to draw higher, but I don’t know yet based on what we have in price action, because the volatility is so high in the first few minutes at 9:30 Eastern Time.
I don’t know where the entry is yet, but I know that I want to look for longs because I think we’ve done enough to balance out on the daily chart and that lower suspension block that I showed.
This is enough to warrant a little idea to build a framework around, but I’m wanting to see that volume imbalance down here act more or less like a breakaway gap, where it’s not so interested in going back down there.
Because if it’s not interested in going back down there, that means this sell-side liquidity raid is sufficient enough to send us higher.
Let’s see if we drop back down into that daily inefficiency that’s been shaded in gray between the two wicks.
Regular trading hours.
So we’re going to color this one purple just because I want it to look different on the chart, and that is where we settled on Friday.
The gap difference from where it closed on Friday to where we are is significant, which is another reason why I think we’re going to go up, because it’s a huge gap.
Gaps tend to fill in, or make an attempt to fill in, let’s put it that way, because the market is predominantly predisposed to go higher.
It’s built as a Ponzi scheme that goes in perpetuity.
They go higher.
Okay, stock prices are meant to go higher to lure in new venture capital investors, and they have to keep the party going.
So it’s more likely that we’ll at least draw toward this purple line.
It doesn’t need to get there.
It’s between where we are going to open up at 9:30.
We want to see it gravitate toward the buy-side and then in the direction of this 30,048.5 level.
I don’t see anything yet, so we have to give it a little bit of time.
What I want to do is show you—this is how I prepare myself when we have a pretty significant gap like this.
You want to grab your Fib and put it right on the level.
So, RTH ORG C.E. — that’s the half-gap.
We’re going to annotate that now so we don’t lose sight of what it is and why it’s there.
Regular Trading Hours Opening Range Gap.
Consequent encroachment on the Regular Trading Hours Opening Range Gap is up here.
So there’s a 70% likelihood it’s going to go up here by 10 o’clock.
That’s usually the statistic.
This part is live trading:
https://youtu.be/rtIcbG6twrI?t=1101
We want to see the bodies stay below half of this wick in here.
So notice what I’ve done today, because I’m not 100% sold on the idea of where the perfect entry is.
I’m exploring. I’m trying to get a feel for what it wants to do because we’re Monday.
We have a huge, enormous amount of volatility coming in on Tuesday and Wednesday because of that.
And we have no news today on Monday, and it’s not Non-Farm Payroll, because Non-Farm Payroll, I’m always trading that Monday.
But this is what you can encounter on Monday.
And if you’re not really versed in knowing what you’re looking for, if you don’t have a model, or if you’re just really undisciplined, you can go out here and wreck yourself very, very quickly.
Because of that, I’m illustrating with one contract.
And if you’re brand new, you shouldn’t be trading with a mini. You should be trading with a micro.
So on a day like this, what we’re doing is trying to explore what the market wants to do, what it’s not willing to do, and then get out of its way on Tuesday and Wednesday in the morning sessions.
Preferably entering and managing positions in the PM session, rather than trying to participate in the gambling session that the PPI and CPI numbers promote.
Because they’re runaway trains.
And if you’re wrong, you’re wrong bad.
It’ll wreck you immediately.
People say it all the time: death by a thousand paper cuts.
That’s what trading is mostly like for retail traders when you first get into trading.
Even if they trade with a little bit of leverage, if they have no model and no discipline, they’ll die by a thousand paper cuts.
Small little losses, over and over and over again, will eventually just bleed you out.
You saw that I did the probe of one contract to see if it could get that run up toward gap closure.
And then when it failed, I knew what I was looking for on the opposite side.
And that doesn’t mean if you take a loss going long, it’s always a sell short.
It doesn’t mean that at all.
If you remember what we were talking about when we first opened up the session, that was outlining how the bulk of the news influence and the volatility injection comes from the CPI and PPI events on Tuesday and Wednesday.
Things go back to normal business post-Wednesday.
So the PM session on Wednesday, then Thursday and Friday, should be really nice, clean trading.
Here, it requires a whole lot more thought process, a whole lot of weighing out if-then statements with your interest in buying or selling.
You don’t want to come in with a hard bias.
You don’t want to do that because when the economic calendar is dictating the pace of how much volatility is coming in, like we have for this week, and we have no volatility expected because of news today, because there’s nothing news-related for Monday’s trading.
So you have to lean heavily on simply the price action and experience, which is the reason why I tell students, try not to trade on Mondays.
Because Mondays are the manipulation and accumulation part of the week, the first day of the week.
When I tell new traders not to trade on Mondays, it’s predominantly every Monday except for Non-Farm Payroll week.
Why is Monday so good to trade during Non-Farm Payroll week?
Because from the middle of the week, post-Wednesday morning session, it’s all event-driven, and you don’t know what they’re going to do.
I don’t know what they’re going to do.
So I know the cleanest price action tends to be on the Monday of Non-Farm Payroll week.
So that’s always a Monday that should be traded.
If you’re brand new, just try to study price action on Monday and be okay with the market creating some stellar price run that you may not have participated in.
When I say don’t trade on Mondays if you’re brand new, it doesn’t mean that someone with more experience can’t trade on a Monday.
It just means that, like you just watched this morning, I wasn’t confident starting the week.
We have significant news that could be used as a mask, like smoke, to cause a distraction from the price action runs that they’re going to present in the marketplace.
Now see how it’s created this low right here on my exit candle, and then we dove down really aggressively.
And now it looks like we’re trying to get back above this high here.
If we can mount a run back higher above this low, the fair value gap that forms bullishly after that will usually, usually send us into the buy-side.
Then likely draw that buy-side and see if we can get up closer to consequent encroachment on the opening range gap.
So if we look at that through the lens of regular trading hours, this is what we see—an enormous gap still from here down to where we opened.
So this is all inefficiency.
I want to see it fail to go lower here and then start going higher.
And then the rest of the day, or going into tomorrow, will be trying to get up into this area here.
Does that make sense?
Because there’s nothing on the chart.
It’s a vacuum of price.
This is a real liquidity void between this candlestick’s low and this candlestick’s high.
That is a liquidity void because there’s no print at all in regular trading hours delivery.
It doesn’t matter if electronic trading hours posted through that, because regular trading hours has to balance out electronic trading hours to be an efficiently delivered price.
You can’t just exist on one session.
Let’s say it this way: it can, and that creates imbalances and inefficiencies that are only seen in one session, being either electronic trading hours or regular trading hours.
But regular trading hours has more weight behind it.
Let’s say it this way: I place more emphasis on regular trading hours than electronic trading hours because regular trading hours tends to overlap and redeliver to levels that electronic trading hours have already seen and delivered overnight.
Well, we’ve been trading since 6 p.m. last night, Sunday, Eastern Time.
So whatever those levels were, we haven’t done that yet in regular trading hours.
So that’s why it’s more interesting for me to see it try to go up into this gap where there are no prints at all in regular trading hours.
I can be wrong.
It could drop right from here and just keep going lower.
But more times than not, it’s going to adhere to this logic rather than do the other.
Does that make sense?
See how it’s gotten to our target?
Now it’s gotten a little bit muddy in here, so I want to see it really mount a campaign to go higher and get back above this low.
If it can’t do it by 10:10, then I’ll bail, watching what price is doing.
If it starts to go lower and gets into the event horizon between these two levels, then my interest is evaded as well.
Daily chart.
And we’re going to drop this little thing down to the volume imbalance right down here.
So I’m dragging this down here.
I’m incorporating the volume imbalance between these two candlesticks.
It needs to be this candle or the very next candle that drops.
If it’s going to go lower, it needs to do that because we’re in this inefficiency.
We had one candle, and we’re in the second candle here.
You don’t want to see, like, a crowded house inside of an inefficiency. That’s not something you want.
We’re not trying to do a block party inside of one little split space between two times.
So we want to see it now displace aggressively lower.
Otherwise, we’re going to a different neighborhood, and that’s going to be up here and up here.
Inefficiencies—you want to have one, two at most. Three, the probabilities start to shift lower.
If you’re booking three to five candles inside that inefficiency, you don’t want to see that.
A market that’s in a hurry to get somewhere doesn’t want to go in the gap.
A market that wants to go in the gap, one candle and not leave a body there, and not close it entirely, or even trade to half its range, or consequent encroachment, that’s a market that is in a hurry to get somewhere.
The fact that we’re spending so many candles inside of this—look at it like this, son.
We have that to that.
Okay, so why, if it’s bearish, why is it spending so much time in that?
You see?
So as soon as you—people say, oh, you count candles. You’re always trading on the 13th candle and the 17th candle and the 21st candle.
They’re all looking for something they can market.
I was going to say, that seems a little crazy.
It’s nuts.
The only time I’m counting candles is when we’re inside inefficiencies, because you don’t want a lot of candles in that little range of inefficiency in price action.
We’re already at like one, two, three, four.
This is the fifth one.
No more than five candles.
This is the last ditch. It’s got to do it now or it’s failing.
That’s the logic I go with.
And already, even if this thing were to drop, I don’t like this.
Think about it.
Say you use this as an entry.
Not that you should, because you’d be selling short in an extreme discount from the daily high of regular trading hours to the daily low, and you’re trying to sell right there at the low.
That right there goes against what I taught in the very first month of my paid mentorship on my YouTube channel.
So, my month one, rather, of the 2016 Private Mentorship.
That playlist—if you just listen to those first four videos, you already know more than 99% of everybody else out there trading.
I don’t care what they use.
You know more than they do, and you can trade more efficiently and consistently if you adhere to the logic and try not to add on to it.
Look what it’s done.
When I first started teaching fair value gaps, everybody in other types of disciplines would say, oh, look at this fair value gap. It failed here, huh?
They’re not realizing that it’s in a discount.
It’s dropped straight from jump street, and you don’t want to sell in a discount. You want to buy in a discount.
Okay, so now, because this has failed to offer premium sensitivity, where it shows an unwillingness to go higher and then falls lower, we’ve spent too many candles in here.
That lesson in this lecture, in and of itself, is enough for people watching this to be like, you know what, that’s useful information.
But largely, it goes unnoticed because they want to know how to get the right entries, when sometimes you don’t have that intel afforded to you in the beginning.
You don’t have the odds in your favor, but you have to recognize when the odds are stacking against you and identify what that looks like.
If you don’t know that, you’re chasing the money.
You know, look what I did, haha.
They’re more concerned about that than, how can I preserve my capital and preserve my mental capital so that I’m not stressing myself out, forcing an idea in the market where it isn’t likely to occur?
So there are times you want to see my PD arrays failing.
The PD array needs to show certain signatures for it to be valid and confirming with your expectation in price action.
But if you can recognize when they’re not confirming, that’s not failure in the sense that they’ve changed the algorithm or it’s the new retail.
See what we did?
I’ll go back to that in a second.
We went right back up to that low.
Why?
Because this failed.
That right there is insight.
From this level here, going back up just above this old low—that price run—if you didn’t expect that, because if this fails, what’s it going to do?
It’s going to draw back up to that low.
If you’re not aware that that’s likely to happen, you could say, well, no, I’m going to force my will on this.
Oh, it could be coming back up for these sell stops—I’m sorry, buy stops here.
And I’ll sell there, or I’ll sell at the midpoint, at the event horizon between this one and here.
It’s probably just retracing.
No.
Why?
Because we had this range from today’s regular trading hours high down to this low.
We had one low, two lows, three lows, then it came all the way back up.
So this completely wiped out anybody that’s short that trailed their stop-loss.
So now we have to test and see: does it want to come all the way back down into this and use this as a discount array and then go higher?
Or does it wilt right through it and come back up and treat it as a bearish fair value gap again to send this back down into lower prices?
Event horizon there.
And then there’s relative equal lows, like I said earlier.
So there’s a whole lot more involved when you’re trading Mondays.
And what I just outlined, I don’t expect my new students to know that.
So as a responsible educator, a mentor, and the person that knows this stuff, just because it’s mine, it would be disingenuous as an educator to not tell them this is where you’re going to fail most.
So if that’s where it’s likely to fall in the column of where do I usually lose the most, on what day of the week, it’s going to be Mondays when there is no news and you have big news on Tuesday and Wednesday.
It’s going to require a whole lot more experience.
And how are you going to lean on that if you’re brand new?
I don’t ever tell my mature students who have been with me for a long time, don’t trade on Mondays.
And they knew when I was teaching, it’s in there.
If you’re new, if you don’t have a lot of experience, just avoid trading on Mondays unless it’s Non-Farm Payroll week.
That’s an always-trading Monday.
Always.
Keep learning with us.
Get new ICT lessons, study notes and updates as we build V2.