
Tuesday, May 24, 2022
2022 ICT Mentorship Live Stream 2
Learn how bearish SMT divergence, fair value gaps, and a low-resistance draw on liquidity guided selective short-side management during a mixed New York index-futures session.
- Bearish SMT Divergence
- Low Resistance Liquidity Run
- Fair Value Gap
- Sunday Opening Gap
- Overnight Lows
- Intermarket Analysis
- Partial Profit Taking
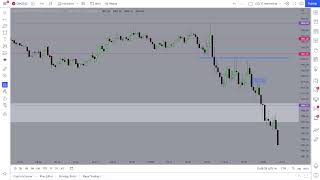 Watch on YouTubeThe original lesson video opens on youtube.com
On this page6 chapters
https://www.youtube.com/live/tczKBQ60BKM?si=dbWLNZRtks6K0XKF
Mapping Liquidity and News
[00:33] We're reviewing the New York morning session on May 24, 2022, with particular attention to the E-mini S&P and NASDAQ futures contracts. There are economic releases scheduled around 9:45 and 10:00 a.m. New York time, so I want to observe how price reacts to those events and whether they provide a clearer directional framework. My intention is to examine the market's structure, identify the available liquidity, and determine whether the conditions support a low-resistance liquidity run.
[01:57] Beginning with the daily S&P chart, price is trading somewhere between the significant high and low of the broader dealing range. We're retracing toward an imbalance above while remaining inside yesterday's daily range. The market has already revisited Sunday's opening gap, and the candle bodies appear to be respecting the relevant imbalance. We have sell-side liquidity resting around 3900, but I don't yet have a strong directional conviction.
[02:59] My initial interest was whether price would rally toward the session opening gap above and potentially attack the nearby high. I'm not necessarily expecting the entire gap to be filled. I simply want to observe whether the market demonstrates a willingness to seek that premium reference before declining. At the moment, however, the conditions aren't even providing a clear 50/50 framework because I don't have enough evidence to favor either direction.
[03:29] Yesterday I discussed the possibility of price trading beneath Sunday's opening gap and subsequently retracing into it. Under the appropriate conditions, that return could provide a bearish reaction. However, the existence of a gap doesn't automatically make it a valid short-entry location. We need to consider the broader dealing range, the liquidity available on both sides, and whether price is demonstrating the structural characteristics associated with bearish continuation.
[04:06] On the 15-minute chart, there are relative equal highs above the market, while Sunday's opening gap remains an important reference below. I'm comparing the S&P and NASDAQ to determine whether either index is showing clearer directional strength or weakness. A low-resistance liquidity run requires a relatively one-sided expectation. If you can justify both bullish and bearish scenarios equally well, you don't have the conditions I want for a high-probability trade.
[05:00] The overnight London lows on both indices are potential downside objectives. Price action has been relatively sloppy, and we have smaller imbalances within the current dealing range, but there isn't a compelling entry yet. With news approaching, I prefer to observe how the market uses the nearby liquidity rather than establish a position before the expected volatility.
Bearish SMT Divergence
[06:32] On the five-minute charts, compare the highs of the June E-mini S&P and NASDAQ contracts. The S&P has made a higher high, while NASDAQ has failed to confirm that movement with a corresponding higher high. This is bearish SMT divergence: one correlated index takes a high while the other demonstrates relative weakness. NASDAQ's failure to confirm the S&P's higher high suggests that NASDAQ may be the weaker market. This doesn't constitute an entry signal by itself, but it provides useful information about the relationship between the two indices and which one may offer cleaner bearish delivery.
[09:24] *I'm more interested in what happens after the 9:45 and 10:00 a.m. economic releases. Often, between 10:00 and 10:30, the market begins delivering a more decisive movement after the initial news volatility. The releases may provide an opportunity for price to attack the liquidity resting on either side of the current dealing range before establishing a clearer direction. *Yesterday, the market initially encouraged bullish expectations around the opening, then traded lower into Sunday's gap before rallying. Today we may see another sequence in which the initial movement is misleading. But we need to observe what the market actually does rather than assume the same manipulation must repeat.
[10:32] I have two important liquidity pools marked, but I cannot confidently determine which will be attacked first. That's an important distinction. I may have an expectation about the broader market, but if I can't identify the next likely draw with sufficient conviction, there's no reason to force a trade. I'm waiting to see whether the news provides a meaningful displacement that clarifies the directional narrative.
[11:07] NASDAQ is decidedly weak and has already traded beneath its overnight London lows. The S&P hasn't yet confirmed that downside movement. Given that the S&P previously traded approximately halfway into Sunday's opening gap, another return into that gap could encourage price to seek its lower boundary. But that's a conditional expectation based partly on NASDAQ's weakness, not a reason to enter short immediately.
[12:34] The relationship between the three indices remains mixed. NASDAQ is trading heavily around its overnight lows, the S&P is interacting with a fair value gap, and the Dow is behaving differently near its opening-range high. This lack of coordination makes the broader market more difficult to interpret. What I want to study is whether the S&P reacts from its current imbalance, breaks beneath the overnight lows, and continues toward the lower boundary of Sunday's opening gap. That would bring its delivery more closely in line with NASDAQ.
[15:12] At the moment, both the Dollar Index and NASDAQ are weak. That's a mixed-market condition rather than the clean relationship I prefer.
EUR/USD is showing relative strength compared with GBP/USD, while NASDAQ is approaching another potential objective around 11,690. The S&P continues to hold above its overnight lows.
I use the Dow primarily as an additional intermarket reference for intermediate-term highs, lows, and market structure. I generally prefer trading ES or NQ because their price delivery is more suitable for the models I'm teaching.
Fair Value Gap Risk
[18:42] Let's examine the smaller structure on the one-minute chart. Price has already rotated lower and broken a short-term swing low, creating a bearish fair value gap. If you were studying a hypothetical short entry around that imbalance, you would want the subsequent retracement to respect the relevant bearish structure.
[19:40] The protective stop for a hypothetical short should be placed using a relevant structural reference associated with the fair value gap and the high that would invalidate the entry. The objective is to define the risk before considering the possible reward. We aren't entering simply because an imbalance is visible; we're evaluating whether the setup offers a logical risk model and a sufficiently clear draw on liquidity.
[21:03] Compare the S&P's market structure with the Dow and NASDAQ. None of the three indices is delivering in exactly the same way. This is what I mean by a mixed market. It doesn't mean a trade is impossible, but it makes it substantially more difficult to identify the next obvious price objective. If you can't determine where price is most likely to reprice next, the better decision may be to remain on the sidelines. We're approaching 10:00 a.m., and the upcoming news may provide a clearer directional movement.
[23:21] When I use the term low resistance, I'm not referring to conventional support and resistance levels above or beneath the market. I'm describing how easily price can deliver toward its objective. A bearish low-resistance liquidity run is one where price can move toward sell-side liquidity without repeatedly encountering opposing price structures that disrupt the movement.
Look at the difference between the S&P and NASDAQ this morning. The S&P has been reluctant to trade lower into Sunday's gap, while NASDAQ has moved toward its overnight lows much more directly.
[23:50] On the five-minute June NASDAQ chart, price has moved aggressively toward the overnight lows established around 3:00 a.m. That is a much cleaner downside run. NASDAQ is also approaching the 11,690 reference, which I'm using as an objective rather than necessarily anticipating a significant turning point there.
The S&P, meanwhile, has already taken several nearby short-term lows but hasn't delivered with the same conviction. That's why we need to evaluate the relative strength and weakness of correlated markets instead of treating them as interchangeable.
Weakness and Gap Delivery
[25:18] The S&P has created a bearish fair value gap during the decline. I would prefer to see that gap remain open rather than being completely filled by an immediate bullish retracement. Price has already traded beneath several short-term lows, and I want the bearish imbalance to continue supporting delivery toward Sunday's opening gap. If the market returns aggressively into that fair value gap, it may indicate that bearish order flow is weakening. Conversely, if the gap remains open and price continues breaking lower, that would support the expectation of further sell-side delivery.
[26:03] The SMT relationship also helps identify which market is preferable for a bearish trade. If the S&P makes a higher high while NASDAQ makes a lower high, NASDAQ is the relatively weaker instrument. If you're looking to short one of those markets, the weaker index is generally the more attractive candidate.
[26:54] The S&P is now moving toward the overnight lows around 3:00 a.m. The question is whether price will accelerate beneath those lows or return into the current dealing range after taking the liquidity. NASDAQ has already traded below 11,680, demonstrating continued relative weakness. The S&P has also moved back into Sunday's opening gap. Since the market previously reached approximately halfway into that gap, I'm now interested in whether it can continue toward the lower boundary and potentially complete the rebalancing.
[28:29] NASDAQ continues declining, while the Dow is beginning to show some additional weakness. A possible downside reference on the Dow is around 31,580. However, the broader market remains difficult because the indices are not delivering with the same degree of coordination.
These mixed conditions are important to study. A developing trader who doesn't understand them may assume every bearish candle is confirmation of a trend and continuously add risk. But the cleaner approach is to recognize which market is delivering most efficiently and avoid forcing exposure in instruments that remain indecisive.
Managing Into the Objective
[29:16] The 10:00 a.m. period is now underway, allowing the market to react to the scheduled economic information. The bearish fair value gap on the S&P has remained open while price continued lower. That's the delivery I wanted to observe. The market has now reached the larger area associated with Sunday's opening gap. Once that objective is fulfilled, I become less interested in initiating fresh shorts. The original draw on liquidity has been reached, so the remaining opportunity may be considerably smaller.
[30:26] If you had entered short using the earlier bearish fair value gap, I would now consider taking off at least half the position, potentially as much as 80%, after price has reached the gap objective. The remaining portion can be managed with a protective stop above the appropriate bearish structure. This is an example of using the liquidity objective to determine profit-taking rather than holding the entire position indefinitely. Once the principal target has been delivered, you've already accomplished the main purpose of the trade.
[31:57] Price has now broken another short-term low. For a hypothetical short, that provides an additional structural development that may justify advancing the protective stop. With the market already beneath Sunday's opening gap, I don't want price returning above the newer bearish imbalance if the downside continuation is genuine. At this stage, the remaining position might represent only 20% of the original exposure, with most of the profit already realized. The stop can be positioned around the relevant structural high so that a reversal doesn't erase the gains captured earlier.
[32:39] The trade is now substantially de-risked. Most of the position has been closed, and the remaining contracts have a protective stop positioned to preserve a favorable outcome. If price continues lower, that residual position can participate. If the market reverses and triggers the stop, the principal objective has already been accomplished.
This is especially important during mixed-market conditions. The Dollar Index and stock indices are declining together, while ES, NQ, and YM have shown different degrees of weakness. That means you need to remain selective about which liquidity objectives you pursue and how much exposure you retain.
[33:18] The purpose of this demonstration was to show how to reason through price action as it develops. We began with conflicting market structures, identified the relative weakness in NASDAQ, watched the S&P's bearish fair value gap, and followed price as it delivered toward Sunday's opening gap.
The important part isn't simply that price reached a projected level. It's understanding the sequence of conditions that made the objective relevant and how the risk could be managed during the movement.
[35:00] If price continues beneath the next short-term low, I would consider taking another partial profit and advancing the stop toward the upper boundary of the most recent bearish fair value gap. If the market is genuinely going to continue lower, it shouldn't need to trade all the way back through that imbalance. That would allow a small remaining position to seek another portion of the downside movement while protecting the profits already taken.
Closing After Principal Delivery
[35:53] Personally, I would now be inclined to close the remaining short and finish trading for the day. The market has delivered into the principal objective, the bearish movement has already provided an opportunity for multiple partial exits, and the broader intermarket environment remains mixed.
Full transcriptICT’s words as supplied. Open to read.
[00:33] Can you hear me? Give me a 5 by 5 on Twitter. I'm not looking at the chat window on YouTube. YouTube. That's for the trolls. Okay, just a little bit of a delay. It doesn't seem as bad as it was yesterday, but all right. So this one probably won't be all that long today. I'm just gonna go into the news at 10, probably like 10:15. We'll in the stream because I have a lot of work to do with video work. But I want to go over real quick, um, time frame.
[01:57] We'll look at the daily. And for the folks that are still complaining about my color I want you to go back to the white background. I, I can't. I'm trying to make the best I can by dimming the background and still going with the color scheme you see in front of you. All right, so we are kind of like in no man's land from this high to that low. We're working back up into this imbalance here. And we're still inside of yesterday's daily range. We already touched the opening gap on Sunday and had imbalance in here.
[02:59] So far it's respecting that. Notice the bodies of that there. So we have sell side resting around 3,900. My interest was initially to see if they wanted to take it back up into this session opening gap. This is where they started trading again last night, $6. So while I'm not suggesting that it's going to completely fill that in, I was looking to see if they wanted to take it back up and just bump this high. I'm not in a hurry to do anything today because it's literally— it's not even 50/50 right now.
[03:29] Like, I, I don't have a clear decision. On what side of the marketplace I want to play, but this is the only interest I have right now. If we take out the Sunday gap opening, as I mentioned yesterday, if we go below that and come back up into it, that to me would be a scenario that could provide possible bearishness. But again, you know, we're speaking hypothetically here over paper trading and charting. You know, you gotta remember this is all opinion. Look at the 15-minute time frame.
[04:06] They left relative equal highs in place here too as well. You extend the Sunday gap. So I was talking a little bit yesterday about how the market needs to be like one-sided, and that's how I classify a low resistance liquidity run. So if it doesn't give you a— or me or anyone else is studying and backtesting and forward testing or demo trading— if you're not able to see one side clearly, you're gambling, okay? And you're wasting your time even with a demo account. So I'm looking at the relationship between the NASDAQ and the S&P this morning at their highs.
[05:00] It looks like they may want to dig into the lows overnight in London on both the E-mini and NASDAQ. So Initially, we're looking down here. Sloppy, sloppy morning. All right, I have a little gap in here. Now there's news coming out in a few minutes and then at 10 o'clock as well. So we're allowing for that to take place and whatever it is, whatever manipulation rather, as a result of that. So let's outline this.
[06:32] Okay, so there's your 2 pools of liquidity this morning. This one here, it just based on the relationship between the highs. Look at the 5-minute chart between the E-mini S&P June contract and that of the E-mini NASDAQ 5-minute chart. You'll see that there's an SMT divergence. That means NASDAQ was failing to make a higher high like we saw in the S&P here. It's not a trade.
[09:24] Don't get crazy and go entering. Protein shake, in case you're wondering. I'm more interested to see what we're doing when they bring the news out at 4— at 9:45 and 10 o'clock. Typically you get like a, a more pure price run between 10 and 10:30, so that kind of like overlaps with after the news is released to the marketplace. So they'll use whatever sentiment I mentioned yesterday that they would use the sentiment with the initial bullishness at the open, and they took that. It took the market rather lower into the Sunday gap opening and then pushed it higher into the day.
[10:32] So we're kind of looking similar fashion today, waiting for the news to come out to manipulate these liquidity pools that are noted here. Admittedly, I do not know which one with high probability is going to be hit first, so that way we understand going forward. I'm waiting to see what they do with the news, and you're all welcome to go on the Twitter and tell me what you think is going to happen first. Just be sure to tell me where your entry, your stop, and your target is too.
[11:07] Everybody wants to come back behind me and say, oh well, he didn't do this, but he didn't do that, but you don't trade live though. Can't say that no more, can they? So just, uh, a minute or 2, we'll have a little bit of volatility probably come in. Now NASDAQ is decidedly weak. It's already taken out its London lows, so we'll have to see if the S&P wants to follow suit and go lower. Now with the fact that we traded into about halfway into the gap on Sunday's gap opening for S&P.
[12:34] To trade into that gap again would, in my mind, expect it to see it go down to the lower end of the gap. That's just going on what I see in NASDAQ. Now some of you are looking at the Dow and wondering why I don't touch that. As I mentioned, uh, yesterday, I'm not interested in trading it because it's A little bit more erratic if you look at it compared to NASDAQ. NASDAQ is still real heavy down near its 3 AM lows. S&P into its fair value gap, and Dow is just flirting with its opening range high.
[13:23] So we're all over the place waiting for the news. What you're studying is, does it hit this, roll down, attack the overnight lows, and come to the low of the gap on Sunday's gap opening? That's what you're observing. That's what you're studying. NASDAQ remains exceedingly weak. Now if you have access to the dollar, you can pull that up on TradingView.
[15:12] Uh, dollar's weak while NASDAQ is weak, and that is a mixed market. We have lift on euro. It's going a little bit higher today. That's the strongest one between it and cable. So NASDAQ 11,690, next level of interest for me. Uh, S&P still holding in. Has yet to take its, uh, overnight lows. Look at your Dow chart, YM. Ugly. That's why I don't touch it. That's why I don't trade it. Intermediate-term highs and lows and looking at market structure, I'll use the Dow as a confirmation of present market structure, but I'm not using Dow for like a trading instrument.
[16:47] I'll look at it in relationship to NASDAQ and the S&P, but prefer to trade either ES or NQ. Are the charts clean? Like, can you see like the wicks and all through the stream? Because I don't have a way of seeing that. I don't want to have too many I'm checking on Twitter for your response, by the way. Thank you, Reggie.
[18:42] Thank you, Mark. So when you're looking at pricing, it's doing things like this. You want to see it kind of respect this swing high, not return back to the fair value gap. So if you were— let's say you were taking this as a paper trade, okay, and you use this fair value gap as your entry. You have this fair value gap here on the 1-minute chart because we already got rotation and took out a swing low. It's less likely to go back to this one. If it does, it's probably going to go for the buy side.
[19:40] That's how I would interpret it. So your stop could be used just for sake of, you know, the risk model for it. This candle's low, that would be basically the high end of the gap. That's where, using this entry, that's where your stop would be for paper trading it. It's not a trade recommendation. I'm not saying get in here. Dollar Index making a lower low for today. Now look at the way the market structure is right now. Compare the S&P to the Dow. Did it look similar?
[21:03] Nothing similar. How about the NASDAQ? Is that similar to S&P? No. So this is what I'm referring to as a mixed market. It doesn't mean that you can't trade it, just means that it makes it very, very difficult, and it's not, it's not clear to determine where the market's going to likely draw to next. Like, where is the next easy objective for it to reprice to? Because if you can't see that, it's better to stay out. Got a couple more minutes and we'll have the 10 o'clock hour start.
[21:36] So I guess what I'm trying to communicate from yesterday and today is there's— there are certain I guess frameworks or structure in the marketplace that is more conducive for a low resistance liquidity run. Low resistance liquidity run is where the market shows a clear defined area of draw where it's likely to go to, like relative equal lows or an old high, and we've been bullish. So it's pretty much next to a no-brainer, if there ever really was. There— nothing's risk-free, obviously, but you're looking for areas that give you opportunity to see the market move from where you're studying it at the market price and define risk in terms of a low risk, and then at least have 2 or 3 of what you were anticipating as a risk for the trade.
[23:21] If you can find that and it's framed on the basis of low resistance liquidity— now when I say low resistance, don't think that it's a move going up because you're thinking like support and resistance, so resistance will be above price. Don't, don't think like that. What I'm saying is resistance in impeding the flow or the fluidity of price delivering to a particular price level. In other words, if we're bearish, how hard has it been so far for the market to trade back down into the Sunday gap?
[23:50] It's been reluctant so far, right, for the S&P. Now look at the 5-minute chart on NQ M2022, or June contract for NASDAQ. That is an easy run to overnight lows. 3 o'clock in the morning. It just went right down there like a knife. Okay, NASDAQ's almost at that 11,690. It's just an objective, it's not like a turning point for me or nothing like that. Dow just being ugly. Ugly Kid Joe. All right, now these are the times where you have to be careful because we went below this low here, we went below this low here, and this low we went below here.
[25:18] While the, while the NASDAQ is going lower, S&P is being fickle. Now, are there— are times when I want to see like that fair value gap that I've just noted here? I like to see those stay open, not see it closed in. And the reason why is because I just outlined we went below this low here, this low below here. And this low here. So I'd like to see this stay open and then run down in the Sunday gap. I would prefer to see that. Why?
[26:03] Because NASDAQ has been heavy, meaning it's been going down easiest between the 2 indices. If you were looking for a short, do you short the one that has the higher high or the lower high? Using what I'm teaching in SMT, you're going to short the one that has the lower high. So that would have been NASDAQ. Now obviously there's going to be cynics in here, why didn't you look at that? Because I'm showing you the relationship. If you just follow one instrument, which is really what you should be trying to do, you should be focusing on becoming a specialist, looking at one market, trying to capitalize on that one market, and Learn its characteristics, trust it, but also refer to other markets.
[26:54] We should get that run below the 3 AM lows now on S&P. The key is, do we go there and accelerate to the downside, or does it pull back into the range that is this high and whatever low it forms? The Dow is still not trying to join the party. NASDAQ has broke 11,680— not yet. 6— here it is, 16— I'm sorry, 11,680's been dusted on NASDAQ. All right, got down into the Sunday gap opening again. We've already revisited half of that yesterday, so think down here.
[27:49] We're already in it, so if it's going to go here, think down there, and that would be an objective for you to take like a first partial or something like that, and your stop would roll to below breakeven, or will be better than breakeven, so that way you don't have any risk. So your stop would be— we'll just use this candlestick high. Okay, NASDAQ still falling out of bed. Dow looks like it wants to roll over. It has a small little 1-minute imbalance it's trying to trade back up into.
[28:29] Let's see if it accelerates to the downside and reaches for 31,580. I'm a lot more interesting when the market's better. These are, these are very boring market conditions, but these are the ones that you need to understand, okay? This is where you hurt yourself if you don't know what you're looking for or what you're seeing. It's hard to interpret it if you don't have the experience. All right, so we have 10 o'clock hour. Whatever impact news is going to bring is going to get priced in now.
[29:16] All right, and that's when you would be paying the trader, taking something out. Notice that we had that gap stay open here. It's almost like it listened, didn't it? So you would roll your stop now to this level here, because if it's going to go back here to that gap, it's not good for being bearish. You don't want to see that. Now we're into a larger leg of Not leg, but an area of order flow, which is that gap opening on Sunday. So since we're down here now and we've completely filled it in to come back up here, I'm not interested in taking another short.
[30:26] So you would be— at least half your position would be off now, if not 80% of it, and then leave the balance on with a stop to here for your paper trade. Okay, hindsight only. We're dealing with hindsight with the time machine. So it's, it's a little bit interesting to see how folks will come into the content, or they'll come to the Twitter, or go to my community tab posts and read them, or go to my comment section on the videos, and they'll say, you know, I've watched this video and I can't make it work.
[31:28] It's because you're not doing this part of it. You're sitting in front of the chart not trying to put a button— push a button. You're not trying to determine you know, where to get in, because all those things in the beginning are the least important. You have to know what it's doing. Where is it reaching? What's it trying to get to? Is there a reason why it needs to get to a specific level? What would that be? Its narrative. Is there an economic calendar event that's likely to come in and inspire some volatility?
[31:57] Is there a Well, if it— things can happen around the world, let's say like that. Something unexpected can happen and cause an upset, something war-related or along the lines of something like that. All right, we just took out that short-term low here. Now when I see that, I like to move the stop a little bit lower. So now we have a gap here, so I don't want to see this gap traded to either now because we're below Sunday's gap opening. So your, your stop would be right in here on your balance, which would be about 20% of whatever the original position was at that fair value gap there.
[32:39] So you're already quote unquote hypothetically booked in profit with only 20% of your original position on, and stops are rolled to a nice you know, place where even if it comes back up and knocks you out, who cares? Who cares? This is a very hard day. The markets are mixed. The indices are dropping with the dollar index. So that right there means that you have to be very careful. Number one, you got to be selective in where you're trying to get to and where's the market going to draw to.
[33:18] This was a beautiful example of that. So I told you I wouldn't be here long this morning, but this is certainly long enough for this to have communicated concept, experience, precision, whatever, fill in the blank. If you are live, if you're here watching me do this and outline it, did we use any rented MT4 servers? Did your chart paint like we were expecting real time? Did your chart turn here on a dime just like mine does? Did I do any kind of sorcery, any kind of trickery?
[34:05] Did I, you know, did I pull some kind of scheme? Did I fraudulently trick you? Did I hypnotize you? Am I paying you to say yes? Am I, am I paying you money to that go out and rep me and, and try to get people to believe that what I talk about and teach is real? Or did you witness it? Did you just witness this? Because if you witnessed this, give me an amen. Drunk Monkey says he must have connected to the same fake MT4 server.
[35:00] I love it. Well, hopefully this will inspire folks that are on social media, on Instagram and on Twitter, to sit down with everyone that has a sincere interest in learning from them, to sit down and show it. Just explain it, give the logic why it should work, and if it, if it's real, then it should pan out. If it isn't, then there's your answer. There's no reason to be a jerk about it. All right, so going forward, because I'm going to close the stream here, if it takes out this low, I would take another portion off and roll the stop to the top of the gap.
[35:53] Okay, another partial should be taken, the stop should be rolled to the top of the gap. It should not ever go back to that point if it's going to remain bearish. And then you would just hold on to see what you can squeeze out of it. If you can get another 10 points out of it, you know, there it is. I would be taking mine out now and closing it for the day and just watch and see what the afternoon session does, but that's just me.
[36:27] You do what you want to do. So hopefully, yeah, hopefully, obviously you guys found this insightful and got something from it. If you did, just give me some feedback on Twitter. I appreciate it. Enjoy the rest of your day. Be safe.
Loading post from X…
A preserved copy is ready if the original cannot load.Loading post from X…
A preserved copy is ready if the original cannot load.Loading post from X…
A preserved copy is ready if the original cannot load.Loading post from X…
A preserved copy is ready if the original cannot load.Loading post from X…
A preserved copy is ready if the original cannot load.Loading post from X…
A preserved copy is ready if the original cannot load.Loading post from X…
A preserved copy is ready if the original cannot load.Loading post from X…
A preserved copy is ready if the original cannot load.Loading post from X…
A preserved copy is ready if the original cannot load.Loading post from X…
A preserved copy is ready if the original cannot load.Loading post from X…
A preserved copy is ready if the original cannot load.Loading post from X…
A preserved copy is ready if the original cannot load.Loading post from X…
A preserved copy is ready if the original cannot load.Loading post from X…
A preserved copy is ready if the original cannot load.Loading post from X…
A preserved copy is ready if the original cannot load.Loading post from X…
A preserved copy is ready if the original cannot load.Take the lesson to your next session.
Plan it on the clock, file the chart where it happened, and see whether the setup actually repeats.