
Monday, May 23, 2022
2022 ICT Mentorship Live Stream 1
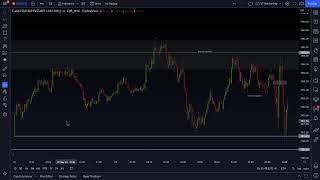
A London raid of Friday’s high, bearish displacement, and a premium fair value gap frame a move toward the Sunday opening gap while quiet news conditions counsel patience.
- Sunday Opening Gap
- Bearish FVG
- Buy Side Liquidity Raid
- Sell Side Liquidity
- Bearish Displacement
- Dealing Range
- Premium Discount
- Economic Calendar
 Watch on YouTubeThe original lesson video opens on youtube.com
On this page7 chapters
https://www.youtube.com/live/-bPi2i-zs9g?si=IL3wQDun6OdqRZ5j
Sunday Gap as Draw
[01:59] We're observing the E-mini S&P during the New York morning session. There are no significant economic releases scheduled today, so I'm primarily interested in studying price delivery rather than pursuing an entry. One area that has my attention is the Sunday opening gap. Price has shown some willingness to move toward it, but I'm not assuming that it must be filled immediately.
[04:00] When the futures market opens on Sunday with a gap, price will often revisit that gap during the following sessions. It doesn't necessarily have to close the entire gap, and there's no rule requiring it to be revisited on Monday. Sometimes the market returns to it later in the week. I want to observe whether price trades into that area and, if it does, whether it reacts strongly enough to support a subsequent bullish movement. That reaction could provide useful information for tomorrow or later in the week.
[04:47] For now, we're simply studying how price responds to nearby liquidity and imbalances. There's a small fair value gap on the chart, but it doesn't yet satisfy the requirements of the model. We also have relative equal lows that price has already cleared, taking the sell-side liquidity beneath them. Those movements are worth noting, but they don't automatically constitute an entry opportunity.
[07:28] Earlier, I was considering whether price might sweep the nearby buy-side liquidity and then reverse lower toward Sunday's gap. So far, however, the market hasn't demonstrated a convincing willingness to rally toward those highs. Price remains relatively heavy, with sell-side liquidity resting beneath the short-term lows and within the lower price range.
On days without high-impact economic news, I generally place greater emphasis on the 9:30 a.m. New York equities opening as the potential source of meaningful volatility. When there's an important release at 8:30, that earlier movement can help establish the framework for what may happen at 9:30.
[08:31] Look at the overnight price action. The market traded above Friday's high, taking the buy-side liquidity resting there, before breaking lower. Notice the timing: the initial movement occurred around 2:20 a.m. New York time. Make sure your charts are configured to New York local time, because these session references and opening-price relationships are important to the model.
London Bearish Model
[09:49] After taking Friday's high, price broke a short-term swing low with bearish displacement and created a fair value gap. It subsequently retraced toward Friday's high and the imbalance before declining again. This is the bearish model appearing during the London session: a buy-side liquidity raid, a market structure shift, displacement, and a retracement into a bearish fair value gap. Around 4:00 a.m., another small Judas swing developed before price continued toward sell-side liquidity. However, my larger point of interest remained the Sunday opening gap beneath the market. That was the reference I highlighted earlier because it represented a potential destination for the ongoing downside movement.
[10:28] Why am I not entering short now? Because I don't have a setup that provides a sufficiently clear risk framework at the current price. Recognizing a likely draw on liquidity doesn't mean the market is offering an appropriate entry. You need to distinguish between identifying where price may go and finding a structure that allows you to participate with defined risk. At this stage of your development, you should be concentrating on reading price action. You don't need to push a button every day. Study whether the market is moving toward the most logical liquidity objectives and whether the patterns you've learned are appearing in the appropriate locations.
[10:57] Watch how price behaves around this short-term low. Sometimes price will stop just short of an old low, retrace to touch it, and then resume toward the deeper liquidity objective. Traders using conventional technical analysis may interpret that behavior as broken support becoming resistance. I'm more interested in whether the market is respecting a specific imbalance or market structure reference that supports further bearish delivery.
[12:48] If price retraces higher, there's another nearby area worth observing. It doesn't necessarily have to reach or completely fill Sunday's gap before producing a reaction. There isn't a major economic release driving the market today, so I'm not expecting particularly aggressive directional movement. This is an opportunity to practice tape reading rather than attempting to capture volatility that may not materialize.
[13:29] Should you automatically avoid trading whenever the economic calendar has no medium- or high-impact releases? Not necessarily, but the absence of scheduled news should influence your expectations. I use the economic calendar to identify sessions where additional volatility may provide the conditions for manipulation and subsequent directional expansion. Any reputable calendar can serve that purpose as long as the event times and impact classifications are reliable.
Testing the Bearish FVG
[14:17] Price has now returned into the bearish fair value gap. The question is whether it will respect that imbalance and begin delivering lower again. If price trades through the gap rather than rejecting it, we may need to consider a deeper bullish retracement toward the buy-side liquidity above the nearby highs. Don't immediately interpret the return into the gap as permission to sell. We're observing whether the price-delivery characteristics support the original bearish expectation.
[15:13] This is an example of forward observation, or walk-forward study. Once price reaches the fair value gap, mark the time and observe what happens next. Does price reject the imbalance and expand lower? Does it consolidate within the gap? Does it trade completely through the imbalance and continue toward buy-side liquidity?
You should also study how long these reactions take. The amount of time price spends interacting with a fair value gap can provide information about whether the anticipated displacement is actually developing.[15:50] Ideally, I would have preferred price to react immediately from the bearish fair value gap and continue lower. Instead, it's spending more time inside the imbalance and showing some willingness to trade higher. The market has also been relatively firm compared with Friday's decline, which may encourage traders to interpret the early movement as a bullish recovery. That sentiment is another consideration when evaluating the potential for short covering.
[16:38] Price has now completely filled the fair value gap. This is precisely the type of behavior you need to study on days without significant economic news. We have a possible downside objective at Sunday's gap, but the market isn't providing the strong one-sided delivery that would normally support a high-probability short. The Sunday opening gap can act as a draw on price, but that doesn't mean the market must trade directly into it. It may take longer to reach the area, or the immediate narrative may change altogether.
[17:43] Suppose you had entered short at the bearish fair value gap, expecting price to deliver directly into Sunday's opening gap. How comfortable would you feel now that the imbalance has been completely filled and price is trading above it? Without a meaningful news driver or decisive bearish displacement, that position would become increasingly difficult to justify.
This is why understanding the conditions surrounding a setup matters. A fair value gap doesn't exist independently of the broader narrative, the time of day, or the expected volatility.[18:14] Price is now above the fair value gap, and the buy-side liquidity resting above the nearby highs becomes a more immediate possibility. A trader who sold solely because the imbalance was present could now be exposed to an unfavorable retracement. By recognizing that the market lacks clear directional conviction, we can avoid forcing a marginal trade.
One of the most important skills you can develop is knowing when not to participate. There are many ways to make money in the market, but there are just as many opportunities to lose it through poor timing, unnecessary exposure, and attempts to trade conditions that don't favor your model.
[20:30] On a day without a meaningful economic catalyst, I'm not interested in increasing leverage or becoming more aggressive simply because price has reached a familiar pattern. The first question should be whether the market is offering an opportunity worth taking. If the answer is uncertain, demand exceptionally clean price action, a clearly defined liquidity objective, and an obvious structural reason for entering. Today we've seen price move beneath sell-side liquidity and then retrace toward buy-side liquidity. That two-sided behavior makes it harder to establish a high-probability directional expectation.
[21:40] There are additional highs above the market that could attract price. But recognizing those possible objectives doesn't mean we have to take a position. I'm teaching you how to identify when the market is offering a genuine low-resistance liquidity run and when the probabilities are closer to 50/50.
I've already participated in an overnight movement, and I don't need to pursue additional trades during the morning simply because the market is open.
[22:18] You might ask why I closed the overnight short instead of holding it all the way toward Sunday's gap. The answer is that today's lack of significant scheduled news reduces my expectation for aggressive directional continuation. When I'm short from a favorable location and there is accessible sell-side liquidity beneath the market, I'm willing to take the easier objective rather than demand a larger movement. The fact that Sunday's gap remains an interesting draw doesn't mean I need to hold a position until price reaches it.
[22:51] Look at the overall market condition. Price is consolidating, trading sideways, and remains firmer than Friday's closing levels. Traders who have been short throughout the previous decline may have protective stops resting above nearby highs. If the market continues moving higher, those stops can contribute to an upside liquidity run. The question is whether the market is genuinely preparing to deliver lower into Sunday's gap or simply consolidating before squeezing short positions. At the moment, we don't have enough directional clarity to justify aggressive participation.
[23:30] I'm also watching the US Dollar Index (DXY). It has taken out a short-term low, and there's a small bearish fair value gap on the 15-minute chart. I would like to see DXY continue lower through that imbalance and attack the relative equal lows beneath today's price action. If the dollar continues declining, that could support a risk-on environment, providing additional encouragement for stock index futures to trade higher.
The bond market is also relatively quiet today, reinforcing the lack of a strong macroeconomic driver.
[24:33] Imagine you've just opened your charts without watching the overnight movement. Your first task is to determine whether there's an obvious reason for price to move strongly in either direction. Identify the available liquidity, the current dealing range, and any significant imbalances.
In this case, price has already taken Friday's high, broken lower, and then spent time trading between the overnight high and low. We're still inside that established dealing range. There hasn't been a convincing breakout in either direction, and both buy-side and sell-side liquidity remain accessible.
Defining the Dealing Range
[27:05] The overnight London session established the current dealing range. Price traded above Friday's high, created a significant high, and subsequently broke an intraday low. Those structural events provide the boundaries for our analysis. Until price demonstrates a convincing movement outside that range, we need to recognize that we're dealing with a market capable of trading in both directions.
[27:41] A dealing range allows us to measure the relationship between premium and discount and identify where a potential setup should develop. Here, the important reference begins with the overnight high that took Friday's buy-side liquidity and extends to the low established after bearish displacement.
If price returns toward a bearish fair value gap within the premium portion of that range, we can observe whether it respects the imbalance and resumes toward sell-side liquidity. But the entry still requires the appropriate conditions; the dealing range alone doesn't provide a trade.
[28:19] Looking at the overnight movement, Friday's high was taken first. Price then broke an intraday low, establishing a bearish structural framework. Subsequent rallies failed to reclaim the original high, although the market did take smaller pools of buy-side liquidity during those retracements. The significant sell-side liquidity remains beneath the short-term lows. If price begins attacking those lows, Sunday's opening gap becomes a logical area to consider as the next downside objective.
[29:32] As we approach 10:00 a.m., ask yourself which side of the market appears more likely to be attacked next. Will price run the highs above the current consolidation, or will it take the sell-side liquidity beneath the short-term lows and trade toward Sunday's gap? Don't answer by immediately entering a position. Use the available evidence to form an expectation, then observe whether price confirms or contradicts it.
[30:15] Think about what traders are likely to believe when they see the market trading above Friday's close. Many will interpret the stronger opening as evidence of bullish continuation and begin looking for long entries. Those traders will typically place protective stops beneath recent short-term lows. That creates sell-side liquidity below the market. When combined with the overnight raid of Friday's high and subsequent bearish structural break, it provides a logical reason for price to seek those stops before potentially trading into Sunday's gap.
[31:46] The lower boundary of the Sunday opening gap provides another reference. The relevant candle high is approximately 3934.50, which also aligns with an imbalance we've been monitoring. I want to observe whether price respects that reference during a retracement and then continues lower toward the resting sell-side liquidity.
Delivery Toward Sunday Gap
[33:16] Price has now reacted precisely around 3934.50, the level identified within the fair value gap. It subsequently delivered lower toward the sell-side liquidity. With that liquidity being attacked, the next logical objective is the Sunday opening gap.
[34:00] There's another relationship worth studying. If price trades beneath a Sunday opening gap and subsequently retraces upward toward it, the gap can sometimes act as a bearish reference, similar to an imbalance being revisited from below. That could become relevant during the afternoon session. For now, the important exercise is recognizing the sequence: the overnight buy-side liquidity raid, bearish market structure shift, retracement into the fair value gap, and continuation toward the sell-side liquidity and Sunday opening gap.
[34:58] *This is what I mean by tape reading. You're observing price without needing to execute a trade. If you've already spent several months backtesting the model, you should now be developing your ability to recognize the same structures as they form in real time. *If you're new to these concepts, begin with historical examples. Learn to identify the recurring patterns in completed data before attempting to interpret them during a live session.
[35:25] Forward testing doesn't have to involve demo execution. You can sit in front of live charts, identify the expected draw on liquidity, mark fair value gaps, and observe the resulting price delivery without entering a position. You're developing familiarity with how the market behaves under different conditions. Today, the absence of a medium- or high-impact economic release means I'm relying almost entirely on price action. Under those circumstances, I want the setup to be exceptionally clear before considering any exposure.
[36:06] On days with significant scheduled news, the anticipated volatility can help establish a stronger directional framework. Without those catalysts, the market may spend considerably more time consolidating. *That doesn't mean a large move is impossible, but its probability may be lower. *Because today's price action has presented both buy-side and sell-side liquidity objectives, I don't see the kind of obvious one-sided movement that would justify aggressive trading.
[36:44] London frequently establishes an important high or low of the day, particularly when the market eventually becomes directional. Today, price ran Friday's high during the overnight session and then broke lower, establishing the bearish framework we've been studying. With no significant scheduled economic release, I'm less inclined to expect a large-range trend day. That means I won't chase every small fair value gap or assume that each imbalance must produce a substantial continuation.
[37:15] The primary lesson this morning is that the market was more likely to seek Sunday's opening gap after already running Friday's buy-side liquidity overnight. That was the narrative supporting the downside expectation. But the absence of a strong news catalyst meant the opportunity was less compelling than a clean, high-probability directional session. The market ultimately moved toward the gap, but I didn't need to enter a new position to benefit from observing that delivery.
[37:45] Earlier, I executed a simulated short during the overnight session and closed the position around 3930.25. I was aiming for a nearby pool of sell-side liquidity rather than holding for the complete Sunday gap fill. Price subsequently continued lower, but that doesn't concern me. The objective was to capture the favorable movement available within the conditions I was willing to trade. There's no reason to regret taking profits simply because price eventually travels farther.
[38:29] The Sunday opening gap has now been revisited, although it hasn't been completely filled. That's consistent with the earlier expectation that the gap could attract price without requiring full closure. The more important question is why the sell-side liquidity appeared more attractive than the relative equal highs above. Friday's high had already been taken overnight, and the market subsequently shifted bearish. That sequence gave us a reason to favor the downside liquidity objective, even while recognizing that a bullish reversal remained possible.
Premium FVG Framework
[39:45] To evaluate a potential short, establish the dealing range from the overnight high that took Friday's liquidity to the low that confirmed bearish market structure. Mark the 50% equilibrium of that range.
For a bearish setup, I want to identify a fair value gap at equilibrium or within the premium portion of the dealing range. That allows the retracement to provide a more favorable location for entering short in anticipation of a move toward sell-side liquidity.
[40:23] Because there was no significant 8:30 news release today, we focused on the 9:30 equities opening as the more important reference for potential volatility. The overnight high and the low established after bearish displacement gave us the dealing range to measure. When price retraced, I wanted to see whether a bearish fair value gap in premium would provide resistance to further upside delivery. If price had continued higher, taken additional buy-side liquidity, and then shifted bearish again, we could have examined the possibility of a new setup from a higher premium location.
[41:00] Price initially traded through the fair value gap, so I wasn't treating the first return as an automatic short signal. I wanted to observe whether the market would continue toward the buy-side liquidity or begin rejecting the imbalance. Instead, price subsequently broke lower, retraced again, and reached the same important fair value gap reference around 3934.50.
[41:26] Look at the precision of that reaction. Price returned to 3934.50, respected the bearish fair value gap, and then delivered toward the sell-side liquidity beneath the short-term lows. From there, it continued into Sunday's opening gap. The fair value gap was positioned in the premium portion of the relevant dealing range, which is why I was interested in observing its reaction. The setup may not look identical to every textbook example, but it contains the same underlying relationships between liquidity, structure, imbalance, and price delivery.
[41:59] Not every fair value gap setup will look perfectly symmetrical or produce exactly the same candle formation. What matters is whether the underlying logic is present. Here, Friday's high had been raided, bearish market structure had developed, and price retraced into a premium fair value gap before continuing toward the anticipated sell-side objective.
You need enough historical experience to recognize these variations without abandoning the rules or forcing entries where the structure doesn't support them.We identified Sunday's opening gap as a possible destination and considered the relative equal highs above as an alternative. The absence of significant economic news made the day less attractive for trading, so I wanted to observe how price behaved rather than initiate a position simply because one of the scenarios appeared likely.
[43:08] Price returned to the bearish fair value gap near 3934.50, reacted from the imbalance, attacked the nearby sell-side liquidity, and traded into Sunday's gap. That's useful confirmation of the price-delivery framework, even though I didn't take a new trade during the live session.
[43:54] Even after many years of experience, I continue studying price action when I'm not actively trading. Observation keeps the analytical process familiar and helps maintain sensitivity to the recurring patterns. You should approach your development the same way. A session doesn't have to produce a trade or monetary result to provide useful information.
[44:33] If you want to plan time away from the charts, consider choosing sessions without significant scheduled economic releases. Those days may offer fewer of the aggressive directional movements we're looking for. You can return later and backtest the price action without feeling obligated to participate live. There will always be more opportunities. You don't need to trade every day or spend every session searching for a position.
[44:58] Some weeks may contain very few sessions that fit your preferred model. That's acceptable. If you've studied enough historical price action, you'll recognize that the patterns repeat frequently enough that missing an individual opportunity isn't a serious problem. The early stages of trading development should emphasize observation, patience, and the ability to avoid unnecessary risk. Treating every trading day as an opportunity that must produce money encourages impulsive decisions.
[46:00] When you sit down in front of your charts, ask yourself whether the current conditions justify a trade. If they do, which direction is more compelling? What liquidity objective supports that expectation? What would invalidate the setup? Then deliberately examine the opposing argument. If you believe the market should decline, identify what would justify a bullish expectation. Record those observations so that you can later compare how your understanding develops through continued study.
[46:24] Over time, that process will improve your ability to recognize when price is offering a clear directional opportunity and when both sides remain plausible. The purpose isn't to invent reasons to trade. It's to develop the discipline to remain an analyst first and an executor only when the evidence supports participation.
[47:02] Looking ahead to the afternoon, price has now taken sell-side liquidity beneath several short-term lows and reached Sunday's gap. There's another imbalance nearby that may influence the next movement. If price remains beneath that imbalance, it could continue trading lower into the Sunday gap and potentially work toward a complete fill. If price rallies back above the imbalance and begins respecting it as support, the market may instead seek the buy-side liquidity above the current range.
[47:37] Both scenarios are worth studying, particularly during the 1:30–4:00 p.m. New York afternoon session. I'm not suggesting an entry in either direction. The important thing is to understand which structural references would support continued bearish delivery and which developments would indicate that the market is shifting toward an upside liquidity objective.
Observation Over Forced Execution
[48:08] Today has been a practical example of why I sometimes choose not to trade even when I have a reasonable expectation about where price will go. We identified the overnight raid of Friday's high, the bearish structure, the premium fair value gap around 3934.50, and the draw toward Sunday's opening gap. Price ultimately delivered toward that objective, but the absence of a significant economic catalyst and the two-sided intraday structure made the conditions less attractive for execution.
Full transcriptICT’s words as supplied. Open to read.
[00:51] All right, I don't know how to see if you can hear or see my screen, but if you could go over to Twitter, help me out here because, uh, I can't tell if you can see me and I can't pull it up on my end. Do you— am I streaming right now? Thank you, Tom. Can you hear me? Can you see the full screen? I guess that's really what I need to see. But can you see my entire screen if I do that? Because I can't pull it up on my side.
[01:59] Is the full screen like you can see the entire price axis and the time axis, correct? Awesome. Thank you. Thank you very much for your patience and help. All right, so I'm gonna just start paying attention here. We'll see what we see. I like the idea of the Sunday gap being revisited so far, but not rushing anything. No news this morning, so I'm more interested in getting acclimated to the live streaming. That way it can be a little bit easier for me to navigate. All right, let's go into There's the gap opening on Sunday.
[04:00] That's what I was referring to in case you didn't see the tweet I posted on Twitter. Usually, not always, usually if there's a gap opening on Sunday, it likes to go down there and revisit it. It doesn't necessarily have to fill it entirely, but I'd like to see it at least Show willingness to get down there. The interesting thing about what I'm looking for is, should it trade down there, does it react strongly like a support idea? Like, does it send price vertical after that? Because if that's the case, we'll be looking for levels like that, like in tomorrow or later in the week.
[04:47] But it's a little too much for right now in terms of forecasting. So all we're going to do is just study a little bit about how prices are reacting this morning without any news. And if you're commenting to me on Twitter or on the chat, I can't see you because I'm more interested in making sure I'm learning how to Make sure this live stream works. All right, small little gap in here, not something that fits the model yet, but I'm, I'm noting it. We have relative equal lows here.
[05:52] We just clear that out. I dabbled, uh, last night. You can see a Used Friday's high here, the sell side in here. That's that. 2022, baby. Everything ICT would never do. Yeah, we're gonna see about that. So there's a little bit of buy side up here.
[07:28] This is what I was watching to see if they're going to try to make an attempt to sweep into that again and then maybe run for the gap on Sunday. That was one of the things I had in mind this morning, but it hasn't shown any kind of willingness to want to do that. It remains heavy, so sell side rests below here and into this area here. Just cycling through our time frames. On days when it does not have high-impact news, you're going to want to make sure that you resign yourself to just looking for the 9:30 opening volatility to give you any framework.
[08:31] When there are— when there is rather high-impact news, we can use 8:30 to set up, you know, framework that would likely give us some foresight into how the 9:30 in the morning volatility may serve us. So one of the things that I want you to observe here is, number one, We've had Friday's highs taken out here. We swept above it, broke down, small little gap in here. Okay, notice the time of day here. It's 2:20 in the morning New York local time. Again, if you don't have your time set to New York, it's going to be very confusing for you.
[09:49] We have swing low broken, fair value gap traded back up to Friday's high, and here is the gap. So here's the model working in London. It breaks down, small little Judas swing here at 4 o'clock in the morning, the sell side resting below here and inside this little bit of an imbalance. But in my thought process is, yes, it went down into here, but this is, in my opinion, the more you know, significant price factor. That's why I tweeted about it this morning. Now some of you may be thinking, okay, why aren't you going short?
[10:28] Because I don't have a setup that would give me framework to provide the risk model right now. It's important for you to just see, does it draw to areas that make the most sense? Not every single day are you going to be pushing a button. Especially right now, you're learning, you're trying to read price action, you're not trying to get in there and, and push a button, try to make money. Some of you are in a hurry to do that and you're really cheating yourself in the learning process.
[10:57] Watch this low here. Sometimes price will just stop short of a short-term low, and like a long candle like this, it can come back up and just touch it and roll forward and get into the liquidity you're looking for. So far it's one-sided this morning. You're not trying to take any trades, you're observing, folks. Some of you already probably got 10 contracts short trying to get rich. ICT's going long, I see he's going on, he's going short, let's get in here. All right, retail will see this right here as support broken, turn resistance.
[12:48] If it's going to come back, back this far, I'm thinking watch this area here. It does not need to fill or even return back to Sunday's gap. That's, that's what I'm watching this morning. I'm having you consider the same thing because there's no real news this morning. We're not trying to play any volatility, just tape reading. We have high-impact news tomorrow. If my memory is correct, I think it's PMI numbers and housing, but don't quote me on that. I know I've never seen it, but it may not be tomorrow, maybe another day.
[13:29] So the question you might be asking or thinking is, do I just simply not trade on days where there doesn't show a high-impact news event or a medium-impact news event? On the economic calendar. And what economic calendar am I using? You can use just about any reputable economic calendar. There's not really any specific one that's going to be better than the other, in my opinion. It's just a matter of how they deliver the— like, I'm, I'm obsessive, so I like things a certain way. And there are some calendars that give the same data and time for events being released, but because the way they present it, it just Doesn't— like right now, some of you are hating the fact that my charts look like this color now.
[14:17] Go back to the black and green and the white background. I would love to. I would love to do that, but my eyes are failing me and I have to do what I can to protect them. So this is more comfortable for me to look at. So please don't send me any posts in my comment section on my videos or on my Twitter asking me to go back to that because I can't. All right, so we move back up into our fair value gap here. Now you want to study and see, does it respect that?
[14:46] Because if it goes through it, then we're going to be looking for a deeper run to get to the buy side here. Again, resist the temptation to want to push the button and get in. You're learning how to do this, okay? You're not learning how to gamble. You're not trying to get in here and push a button and see what happens. You're studying price. Watching, seeing what it does. Does it show signatures that repeat? Is there any logic to the market this morning? Is it trying to get somewhere in an obvious manner?
[15:13] So far, the only thing it's done is return back to the fair value gap. Now, if you want to Like, I guess, how would you study this? Like, this is like a walk forward, not a back testing, but it's a walk forward study from the point at which it touched the fair value gap here. Note the time that it did it and how long does it take, if at all, because it could just run right over top the fair value gap and run into the buy side I have here.
[15:50] But I want you to think about how much time it takes for price to move away from either above and invalidate that fair value gap or move away from it and run into the Sunday gap. Looks a little too overzealous in here. I would have rather seen it come off that and go lower. Traders are waking up and seeing how equities are firmer from last week, so that kind of builds in the idea that, hey, maybe it's time to buy. And they're going to utilize that sentiment this morning.
[16:38] No real economic data to key off of, but One second. Okay, we have complete closure of the fair value gap. Now, on days like this with no news, okay, these are the types of things that some of you are just— you don't want to be met with this type of data, but you have to see it. You have a day with no economic news, you have no drivers for the calendar saying that high impact or medium impact news events should transpire. I'm teaching you to be mindful of the Sunday gap opening.
[17:43] That usually acts like a magnet. It draws price. It doesn't necessarily mean it's going to go there immediately on Sunday's trading or Monday's trading. Sometimes it'll be revisited later in the week. There isn't really a rule that says it has to come back by a specific time. But right now, looking at this, I want you to study how much time it's spending this fair value gap. And let's assume for a moment that you did take that fair value gap as a short for Sunday's gap. Look where it's drawn to now.
[18:14] Do you feel comfortable on a day where there's no economic data, nothing really that's setting up a volatility that would be one-sided? There's no— there's There's no strong one-sidedness for the market to push other than just to keep pushing the idea, the narrative that it's bullish. So we're above the fair value gap. You wouldn't have to take that stop loss right there. Look for the buy side above these highs right in here now. Knowing what you're looking for keeps you out of trades that would be marginal, and knowing what you're looking for when there's an economic calendar behind you with volatility sets the stage for manipulation.
[19:13] One of the hardest lessons for me to beat into students' minds, I found, is teaching them how to know when not to do something. That was the lessons I wish I would have learned early on in the early '90s. There's many ways to make money, lots of ways to make money, but but there are just as much, if not more, ways to lose it. And if you understand the conditions in the marketplace that will invite those environments or circumstances in your trading— in other words, how do you differentiate what day to trade?
[20:30] Well, number one, the economic calendar. You know, I'm looking for a medium impact or high impact news event around 8:30 or maybe at 10 o'clock something to that effect, because I know they're going to utilize that for manipulation. So if they have no real economic news being released that day, generally— not all the time, but generally— you're going to have a lackluster trading session. So that means, is that a day where you would put in your typical risk if you're going to take a trade, or would you elevate your risk and take larger trades?
[21:05] No, first thing would be justifying whether or not you should be taking any action at all. That means demanding the price action be absolutely pristine, seeing exactly what you're looking for, a very clear level to react to. I was looking for somebody's gap. I want to see that be drawn to. We got down below short-term low here, but right from the opening it's just more or less been a drop down to take sell side out, now buy side. Is the next likely, uh, candidate for a run.
[21:40] These highs over here look a little suspect as well, so just be mindful of that. And there's some— I, I guarantee I don't see it, but I know there's some trolls in here thinking, oh yeah, you know, it's going up or down, anybody can do that. Now I'm teaching you how to read, how to stay out of the marketplace. When is it a good time to be trading? When is it 50/50? When is it not likely to present something that's a high probability? And I've already executed overnight, so I'm already— I'm for my liking.
[22:18] And you're probably asking, well, why didn't you wait for it to go down to the Sunday gap opening? If you sold short up here, why'd you take a profit early and not run to Sunday's gap? Because That's one of the things that I'm kind of pushing to you now. There is no high-impact news today. There's no impact on medium or high end. So I'm going to take the easy low-hanging fruit if I'm in a position getting short up here. There's sell side below here and here and here, but it is likely to do what?
[22:51] Look what this chart's showing right now. Look at all the data that I have right now. Is it bullish? Is it bearish? Or is it consolidating? It's consolidating. It's sideways. We're firmer. We're higher than we were obviously on Friday, and it's building in a bit. So it's trying to, you know, draw price higher. It's squeezing on shorts. A lot of people, you know, are hoping this thing goes to zero. It's not going to zero, folks, but I'm just saying that they're— they've been extremely bearish because they watched Friday go down.
[23:30] So anyone that's been short prior to Friday, their trail stop losses are on the menu. I'm just taking a look at the dollar index. Took out that short-term low. Looks like we could go a little bit lower. On dollar, there's a small 15-minute fair value gap on dollar. I'd like to see it go through that to the downside. And there's relative equal lows on today's lows. I want to see it penetrate that. If it does that, that gives us lift for the index futures to go higher.
[24:33] So dollar lower opens the gates for higher prices on index futures because that would be a risk-on scenario. Watch that fair value gap in here. The bond market's not doing anything today. It's quiet too. Now assume you just opened your computer up, you haven't watched any of this price action, you haven't referred to anything, you're sitting down in front of your computer, you're looking at the market, you're looking at this particular market, ask yourself, is there anything that stands out as obvious?
[27:05] Is there anything that would set up the stage as a one-sided move either higher or lower? Because we have both conditions here. We have clean highs. Only thing going for it is we already took out Friday's high and we already broke down from this dealing range high, this dealing range low. We're still inside that range with all this price action. Nothing has broken to the upside or downside. We're still inside the dealing range that was set by overnight London trading here, this low and this high.
[27:41] And the question is going to be, what do you mean by dealing range? Okay, a dealing range is where market structure has provided a means for a trading opportunity and has moved outside the boundaries, which would have been this low and Friday's high. So it ran above Friday's high, it broke intraday low here, there. Watch the fair value gap now because we took liquidity here and here. So it could come back up and revisit that. If it does, study and see if it has any kind of sensitivity there to go then down into Sunday's gap.
[28:19] But back what I was saying, we're inside the dealing range between the high here that was piercing Friday's high. So Friday's high was taken out here, it broke down, it gave a logical setup as I mentioned earlier in the stream. Sell side, you can see again, I I, I operated and engaged with that logic. Now we have this low here, so the significant sell side is here, but below that, where would it want to reach to if it goes there into Sunday's gap opening? Let me scrunch this up.
[28:50] There's Sunday's gap opening. So sitting down in front of the computer, the first thing I'm looking for is how did we trade overnight. Well, we took Friday's— like, let's assume I didn't do anything in London. I'm looking at how it went above Friday's high, it broke down. So we have built in— we have the advantage of Friday's taking buy side. So in other words, the high on Friday's taken out, we've broke down internally on the intraday. We rallied once here, didn't get back above Friday's high.
[29:32] Rally here, we failed, failed. It went lower. Then we rallied again, swept 1, 2 highs on buy side, wasn't able to get the buy side liquidity here. We have sell side below this low and this low. So if it goes for the sell side Doesn't it make sense that we want to reach into Sunday's gap? Now with that logic, which is in your opinion— and I'm gonna have to see this on Twitter, um, just respond to me and send me a tweet with a number 1— right now it's at 1 minute to 10, so 9:59.
[30:15] Is it more likely to take the sell side out or the buy side right now. Some of you are already pushing buttons. I'm selling short. Don't do that, you're cheating yourself. I'm not going to be doing cryptic messages to try to give you signals. I'm teaching you how to read price. I'll push some buttons on the demo in front of you, but it's got to be the right setup and framework. I'll teach you how to manage the pseudo-risk in it as well. Think about what the public is thinking.
[31:16] They woke up this morning, they're looking at the equities opening. It's up, it's up from Friday's close. It's going up a little bit, you know, a couple minutes ago. So they're thinking what? It's going higher. They want to do what if they think it's going higher? What are they going to be doing? They're going to be wanting to buy. So if there's going to place buy orders into the marketplace, where are they going to put their stop losses to protect their long positions? Underneath recent lows, right?
[31:46] That would be here and here. And the logic is the markets want to— sometimes, most of the time— want to fill in those Sunday gaps. You see that? Look at the gap discount low. In other words, it's the lower end that frames the, the gap. What's this candle's high? 3934.50.
[33:16] I told you to watch the fair value gap. What's the high on that candle? 39.3450. You cannot beat perfect. Where did it trade to? Sell side. So if it's going to take that, where it's going to go into? Sunday's gap. So now you want to study, does it go into the entire closure of the gap, which would be right there, that high? So 39.04 even, you want to have that level on your chart. We'll take the shaded part out. Let's drop a line on it. Okay, so it needs to look like that.
[34:00] Now for your notes, if we trade below a Sunday gap and trade back up to it, sometimes it'll act as resistance. So you can look at that and study that going into the afternoon session, which I won't be with you for. We're going to close the stream here in about 5 minutes or so. So when you're watching price and studying and going through your charts, looking at the things I'm teaching you, this is what you're doing. This is tape reading. You're observing. This is where all of you, since January when I first started doing this mentorship for free on YouTube, this is all you should be doing.
[34:58] If not this, you should be obviously spending your time on the weekends back testing and studying old data. Not doing it with live data, but observing once you've done a significant portion. Because I know a lot of you have already started in January with the things I've taught. So you're going through your charts and you've seen lots of examples of it. So now what you're doing is the next stage is to do what we're doing here. So if you're new, if you just started following me, don't do this part.
[35:25] So I'm not trying to, you know, confuse anyone. Obviously I'm working forward with the people that have already started with me in January of 2022. At this point, right about now, because you should have done enough back testing and convinced yourself that this pattern exists, it's there. Now going into the live markets and studying it forward, notice that there's no paper trade entry, there's no demo entry. There's no pursuit to get into a live trade. You're going through the motions of looking at the circumstances that lead to high probability.
[36:06] Does the market give you insights based on the economic calendar that there's going to be volatility in the marketplace? That's going to be in the form of either a medium impact or a high impact news driver, some kind of report. Some kind of data point that comes out. Since there's an absence of that this morning, we're resigning ourselves to relying solely on price action. So, so solely on price action, it needs to be perfect. It needs to be a perfect one-sided setup, whereas right now we had both sides offering buy side and sell side.
[36:44] And what I outlined was it has already done a run on buy side overnight. And London tends to make the high of the day or the low of the day. Not all the time, but largely you find that's the truth if it's going to be a directional market for that particular trading day. Because we have no real data points coming out on the economic calendar, that should immediately reduce your interest to saying, okay, it's probably going to be a small range day. It won't be one of those big large range days.
[37:15] I'm not saying it can't do that, I'm speaking in terms of probabilities. So if it's less likely to be a large range day where it's one-sided, we don't go in with our guns blazing trying to shoot at everything that looks like a fair value gap, demand it do something obvious. Okay, so the only thing I did with you this morning is sit down and give you the logic that it was more likely to do a run to the gap because of overnight run on Friday's highs.
[37:45] And again, for those that are just getting into the session, the only thing I pushed a button on today was here and then covering the whole show there. Okay, so I was looking just for this little pool of liquidity right there. That's all it was. So when you look at these arrows Don't think I got out at that low. Look at the price, $39.30 and a quarter. Okay, so that's right about there. That's right in that low. That's all I was aiming for. I didn't want to hold it because we all have added data.
[38:29] There's no economic high-impact or medium-impact news events this, this morning, so it could do what we saw here. It went a little bit lower than where I got out. Who cares? I don't care. And the setup that I was looking for was just kind of like what I was outlining this morning, is we want to see price draw down into this gap, and it has done so. So did it completely close in the gap? No. Does it need to close that gap? No. So take away this in the, in the whole lecture today: which pool of liquidity had more energy drawing price to it, these relative equal highs, which are absolutely something to be mindful of because it could very easily just return back up in there when it was doing this run.
[39:14] But we have already done the work of running Friday's highs overnight here. Then we broke internally the market structure here. So all of this retracement back into this high to that low. I saw Hannah's video. Hello, Hannah. I'm gonna give you something in Tuesday's video specifically that I want to highlight in your video. I'm not going to play your video, but I'm going to go to the minute marker and show something that you said. So I want to help you out in there and help your viewers and mine as well.
[39:45] But the dealing range high and the dealing range low here, that's the range that you're looking for to look at the relationship between premium and discount. So if this is— I guess we'll just do it. There's 50%, our equilibrium. Okay, so if you're looking for a draw on liquidity down here, you want to find your dealing range. Dealing range is the high formed overnight down to the low prior to the session starting, 8:30 News embargo. Well, there is no news today, so we have to go— what?
[40:23] Go right to 9:30. So at 9:30, right there— well, it's on a 4-minute chart, so it's a little wonky. The, the idea is you want to see, does it have a fair value gap in a premium market? What's your, what's your dealing range? Overnight high and the low that broke structure over here. So everything now— the framework is in play for a short into this area if there's a fair value gap that forms at equilibrium or above it relative to this range high and that low.
[41:00] That's the fair value gap I mapped out. We went through it. Yes, we're not trying to rush a trade, we're not trying to do any of that. We went above it. See if it takes this buy side, because if it would have done that and then broke down and offered a higher fair value gap, I would have mentioned that. It didn't do it. It started breaking down. I said I could watch the fair value gap, went through it, came back up, bumped the same level high again.
[41:26] Look at the high of this candle. You're looking at this price up here, folks, in case you don't know what I'm looking at. This candle's high, 3934.5. We went back through it. This candle here trades right back up to that same price level, 39.34 and a half. Watch and see if it respects that fair value gap. Does it? Yes. Where's it go? Sell side, sell side into the Sunday gap. This fair value gap, is it at a premium or is it a discount relative to the dealing range high here and here?
[41:59] Premium. The fact that it's not so pretty, it's not so textbook, it's not so— well, it doesn't look like what he talked about in that one episode. Okay, I see some of your comments, and I believe some of you are actually sincere about your doubts and your concerns, but not every single trade is going to look identical. They're going to be very similar, but this is a day where I'm trying to teach you. Now, this is the main thing. Write this down in your journal today.
[42:31] We watched price deliver to where we were expecting it to trade to. The ideal scenario was Sunday's gap opening. It traded to it. I put into a fair value gap. I explained how the market is more likely to go to the gap than to the buy side, but let's watch and see if it takes the buy side. No trade was offered. No setup was an entry. And I talked about how this day, because there's a lack of news, is that high probability? No, it's a low probability.
[43:08] So that means you have to demand more from price action. Some of you, if not all of you that are new, would have never been comfortable watching price go back into that low end of that fair value gap and expect this. But when we were dropping down, I said watch the fair value gap. 39, 34.50. Perfect delivery back to the discount low. That makes the low end of the gap. Then it delivers to this low, this low, and into the Sunday gap. On Twitter, I tweeted my interest was that gap, so Your question is going to be, if you're not trading, you know, what are you doing?
[43:54] This is what I'm doing. I'm studying. 30 years of experience is only useful if you're staying active. You want to keep your, uh, your skill set honed. So even if I'm not trading, I'm still studying price because it keeps me dialed in because I have commentaries and things I have to lead students in the right direction. So I keep myself plugged in to price action even if I know— I already know I'm not taking a trade, I have no interest in taking a trade. Those days are relegated to the days I know that there's no high impact or medium impact news events.
[44:33] So if you want to have a day, or let's say a trading week, where you want to plan a day off with your spouse or significant other Um, choose a day that doesn't have high impact or medium impact news and just give yourself that day off, and then go back and backtest it later on. Who cares if it has a big move that day? Chances are it's not likely to do that. And don't think that you have to be in every single trading day. You don't.
[44:58] There's a lot of times where I'm not interested in a whole week of trading because the type of news drivers And that's okay because I know that these things repeat enough. I'm not in a rush. I'm not, I'm not afraid of missing something. And that's the importance of how I teach. I take my students through a very boring first 6 months because you're actively trying to go in and push a button. And I know because you're thinking this is a video game. Folks, this is not a video game.
[45:31] This is an invitation to the financial graveyard if you walk in there looking for, you know, a hole to fall into. There's lots of them, lots of that opportunity. There's lots of people out there teaching you how to push a button and get into a trade. There's no one teaching you how to avoid trauma. None of those— that none of those factors are ever touched on because 99% of people out there that are trying to teach, they are not profitable traders. They're doing something that's silly.
[46:00] They'd be either doing something that's manipulated, showing you fake results, or they're doing with a market replay type scenario. If they know how to do it, they're going to call it and outline it and give the logic why it should do what it should be doing. And that's what I'm showing you here. When you sit down in front of your charts, you need to be thinking like this, asking yourself questions. Okay, if I was in the market right now, would I be wanting to take a trade?
[46:24] And if I were, would I be wanting to go long or short? What would justify me being long or short, and vice versa? As soon as you get to that conclusion about what you would want to do, start looking at it from the opposite side and journal that discovery, because you're going to see how you look at price now and how you're going to look at it come December, around Christmas time. I promise you folks, I promise you, you will see things in the chart that you're not observing right now, and it's going to be clear to you come December because you've put in months of reading the tape like this, studying it.
[47:02] All right, now in this circumstance— now I'll leave you with this, okay? We have traded down below the sell side here and here. We have an imbalance right there that might be a factor that could send us one more time deeper into the Sunday gap. If we rally back above this gap here, think of that like a mile marker, that it should not go back above that. If it does, it could act as support there and send us into the buy side and maybe even deeper here.
[47:37] Study it. I'm not saying it's a trade, okay? But as long as we stay below this imbalance the likelihood is we could move between this range low and whatever high forms here, and it would likely become a little bit heavier to trade into that gap entirely. Should we trade into that gap and go below it, watch that in the afternoon session between 1:30 and 4 o'clock. That might be an area to, you know, to study for the afternoon session. And I think that is going to be it for today.
[48:08] I don't want to give you too much more than that because again, it's just It's a day where I personally would not be involved in, but I want to give you the reasons and the logic as to why I wouldn't participate in it. It's not enough for me to say, well, that's a day I wouldn't have traded anyway, you know, and sound like a smart guy. I'm telling you the reasons why so that way you can use that same logic going forward and hopefully present the opportunity for you to have a life outside the charts.
[48:32] Even though the markets are trading, it doesn't mean go in there, oh, you know, I got, I got to get in front of these charts and push a button. No, you don't. Who says you got to do that? The gambler inside of you says that. Okay, so you want to keep the analyst in the driver's seat, okay? And let's keep the gambler out of it. He's got to be in the back seat, or she's got to be in the back seat. Don't, don't invite them to drive because they'll steer you right into a tree.
[48:56] All right, so we're back into that fair value gap. We're above it, so think here now, okay? And we'll study in hindsight on Twitter. I guess I'll post something later on this afternoon. I have lots of work. I'll get it done with my private group. Hopefully you found something here today insightful, and I will try to do this again tomorrow around the 8:15 time period. We'll meet again. Okay, until I talk to you next time, be safe.
Loading post from X…
A preserved copy is ready if the original cannot load.Loading post from X…
A preserved copy is ready if the original cannot load.Loading post from X…
A preserved copy is ready if the original cannot load.Loading post from X…
A preserved copy is ready if the original cannot load.Loading post from X…
A preserved copy is ready if the original cannot load.Loading post from X…
A preserved copy is ready if the original cannot load.Loading post from X…
A preserved copy is ready if the original cannot load.Loading post from X…
A preserved copy is ready if the original cannot load.Loading post from X…
A preserved copy is ready if the original cannot load.Loading post from X…
A preserved copy is ready if the original cannot load.Loading post from X…
A preserved copy is ready if the original cannot load.Loading post from X…
A preserved copy is ready if the original cannot load.Loading post from X…
A preserved copy is ready if the original cannot load.Loading post from X…
A preserved copy is ready if the original cannot load.Loading post from X…
A preserved copy is ready if the original cannot load.Loading post from X…
A preserved copy is ready if the original cannot load.Loading post from X…
A preserved copy is ready if the original cannot load.Take the lesson to your next session.
Plan it on the clock, file the chart where it happened, and see whether the setup actually repeats.