
Wednesday, January 26, 2022
2022 ICT Mentorship Episode 3
Internal range liquidity establishes the context for intraday market structure shifts, using lower-time-frame fair value gaps and order blocks to frame entries and nearby objectives.
- Internal Range Liquidity
- Market Structure Shift
- Buy Side Liquidity
- Sell Side Liquidity
- Fair Value Gap
- Order Block
- Stop Hunt
- Low Hanging Fruit
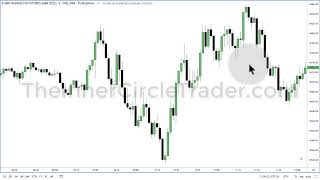 Watch on YouTubeThe original lesson video opens on youtube.com
On this page7 chapters
[00:17] This is the Tuesday, January 25th, 2022 ICT Mentorship lecture on internal range liquidity and market structure shifts. I gave you homework on the Community Tab using this chart, asking you to identify the reasons for the market structure shift and the buy-side and sell-side liquidity.
Mapping Liquidity Pools
[01:00] Here is that chart again on the 15-minute E-mini NASDAQ 100 futures contract for March 2022 delivery. We have an old low and relative equal highs. Below the old low are sell stops, and above the relative equal highs are buy stops. You could use this individual high, but when I see relative equal highs that are higher than an older high, I generally prefer the relative equal highs as the liquidity reference.
[01:50] Price trades down through the sell-side liquidity and then rallies all the way back up through the relative equal highs, taking the buy stops. At both of those locations, you can begin anticipating a market structure shift, but you do not force it.
[02:29] For intraday trading, I want you to think in terms of market structure shifts, because an intraday shift does not necessarily imply a prolonged multi-day change in market structure. A bearish intraday shift may simply produce one downside price leg before the high is taken later that same day. When I use the term market structure break, it carries more context than an intraday market structure shift.
[03:22] An intraday market structure shift simply suggests that there is likely to be an upside or downside draw within the session. Above these relative equal highs, we would anticipate a false run higher and then look for evidence of a bearish market structure shift.
[03:59] Keep these price areas in mind—approximately 14,600 and 14,820. Now drop from the 15-minute chart to the two-minute chart and look at the same day.
Lower-Time-Frame Shift Context
[04:37] Here are the relative equal highs and the corresponding downside run. Without carrying the important higher-time-frame levels onto the lower-time-frame chart, it is easy to become lost in the noise. Strip away your preconceived ideas and look at the price action as simply as possible.
[05:33] Forget about order blocks, breakers, supply and demand, Elliott Wave, or anything else for the moment. Look at this low. Immediately before that low forms, there is a short-term swing high.
[06:07] In the first mentorship video, I mentioned that high-frequency algorithms use market structure on the three-minute, two-minute, and one-minute charts, and frequently on sub-one-minute intervals such as 45-, 30-, and 15-second charts. If these algorithms are operating every day, their signatures should repeatedly appear in price action.
[06:48] This short-term high becomes significant when it is taken only because price first traded into sell stops beneath an old low. That old low could be a single low, a double bottom, or another obvious level retail traders would view as support.
The context matters. A short-term high being broken by itself is not what makes the signal important.
[07:28] The same logic applies above old highs. Liquidity rests above them because traders routinely place protective buy stops there. Buyers and sellers are continuously entering the market, but in my framework, conventional buying and selling pressure is not what determines where price will ultimately be delivered.
[08:46] I want you to test this logic yourself rather than simply accept what I’m saying. The important point is what happens after price runs above these relative equal highs.
[09:21] Once the relative equal highs are taken, you anticipate a market structure shift. You do not force it or try to get ahead of it. With more experience there are ways to participate before the shift is confirmed, but that is not what developing students should focus on.
[09:53] A swing high consists of a high, a higher high immediately beside it, and then a lower high. When that short-term swing high is broken after liquidity has already been taken below the market, the break becomes meaningful. The market can then begin seeking buy stops or buy-side liquidity above subsequent highs.
[10:36] I also showed live executions using micros. The Micro E-mini NASDAQ is approximately $2 per handle, or $0.50 per tick. The full-size E-mini NASDAQ shown here is $20 per handle, with four ticks making one handle. The purpose is to show that these smaller internal swings can be traded when their context is properly understood.
[11:21] Your homework is to take what I’m teaching here and try to prove it wrong in historical charts. That is what backtesting is for. I’ll show you what to look for, how to annotate it, and how to build a study journal, but your job is to verify whether these ideas actually repeat.
[11:55] Do not take my word for it. Go into your charts and study it yourself. Once you repeatedly see the same logic unfold, the chart itself will convince you. Keep the chart clean and annotate only what is necessary.
Fair Value Gap Entries
[13:03] Here are the sell stops below the 14,600 area on the 15-minute chart. Price trades into that liquidity. You do not need to know in advance that the low itself is a buy. Instead, you wait for price to rally through the short-term high and produce the condition that suggests a potential intraday opportunity.
[13:42] The short-term high is taken, and price does not need to close above it. Once that candle closes, watch the next candle and determine whether the three-candle sequence creates a fair value gap.
A fair value gap forms when the first candle’s high and the third candle’s low do not completely overlap, leaving a portion of the range that has experienced one-sided delivery.
[14:18] Once that fair value gap exists, the following candle provides the earliest area where I would consider participating. Price retraces into the gap and rallies.
There is also an order block inside the sell-side liquidity pool. These consecutive down-close candles form one continuous bullish order block. The opening price of that series becomes the important price level carried forward in time.
[15:25] When that order-block opening price falls inside the fair value gap, it can be used as a precise limit-order reference, allowing for whatever spread is appropriate to the instrument. From there, price begins seeking the buy stops above the old highs.
[16:31] In the live execution example, I was trading several of these internal swings—covering shorts, going long inside the order block, exiting and reversing, buying again, and ultimately selling short for the larger downside move. The purpose is to show how the same liquidity and market-structure logic can be applied to the internal price swings.
Bearish Shift and Objectives
[17:37] The important thing is to test the framework repeatedly. Here, the buy stops above the highs are taken. A swing low forms, and once the next candle trades below that short-term low, we now have a bearish market structure shift specifically because buy-side liquidity was taken first.
A fair value gap then forms. Price retraces into it, and that is where the short is entered.
[18:12] Once short, look beneath price for sell stops and imbalances. If you are trading multiple contracts, you can use those locations for partials. The same concepts can be applied to Forex as well as futures.
[19:21] You do not necessarily want to take a partial at the first tiny low beneath your entry if it offers very little movement. Look for the more meaningful nearby low-hanging-fruit objective. Also consider where price sits relative to the dealing range. In this example, the objective is below the 50% level of the high-to-low range.
[19:51] This candle’s low represents the upper boundary, or first objective, inside the old fair value gap. That is the low-hanging fruit—the easiest logical target to reach. You are not trying to be perfect. With experience, you may eventually hold for the full rebalance of the fair value gap down to the opposing candle’s high, but that comes later.
The simple process is: identify liquidity, observe what happens after it is taken, and allow the market to show its hand.
[20:38] Now look at the same price structure on the one-minute chart. The characteristics are unchanged. Liquidity is taken, a short-term high is violated, and the market structure shifts. What changes is that the one-minute chart exposes more of the internal delivery.
[21:22] When price begins moving higher, the increase in incoming orders itself is not what I consider the cause of the rally. In my framework, the price-delivery algorithm is continuously offering higher prices. That also explains why execution can produce slippage.
If you submit a market order expecting 14,662 and receive 14,664, that is negative slippage. If you receive 14,661 instead, that is positive slippage because your fill is better than expected.
Order Blocks and Delivery
[23:13] On the one-minute chart, price breaks lower, retraces into the fair value gap, and sells off. Another fair value gap offers another execution point. These two consecutive up-close candles form one bearish order block.
[23:50] The opening price of that bearish order block is extended forward in time. What makes it meaningful is the surrounding context: liquidity has been taken, a market structure shift has occurred, and an imbalance has formed.
An order block is a change in the state of delivery.
[24:30] Price is being offered higher through the consecutive up-close candles. That series begins at the opening price of the first candle. Once price trades below that opening, the state of delivery changes. That is why the opening price becomes sensitive when price later returns to it.
[25:07] The same logic applies to a bullish order block. A series of down-close candles begins from an opening price while sell-side delivery is being offered. Once price trades back above that opening, the state of delivery changes from offering sell side to offering buy side. The market then begins seeking buy stops.
[26:07] Conversely, when the opening price of a bullish sequence is violated to the downside, the state of delivery shifts toward sell side. Price then begins seeking sell stops and sell-side liquidity beneath old lows.
[27:25] In this example, price ultimately trades down toward the 50% level of the dealing range. Relative to the selected high and low, 50% is equilibrium. Above it is premium; below it is discount. The imbalance we are targeting rests in discount.
[27:59] The same imbalance can look different depending on whether you view it on the three-, two-, or one-minute chart. You should move through those lower time frames to clarify market structure and identify imbalances, old highs, and old lows.
[28:31] As price rallies, it takes buy stops above successive highs. When multiple highs form just beneath an old reference point, traders begin viewing that area as resistance. That engineers liquidity because protective buy stops accumulate above those highs.
That liquidity is useful because smart money that accumulated at lower prices can sell into buyers willing to transact at higher prices.
[29:42] On the one-minute chart, you can see the individual fair value gaps and order blocks more clearly. What appears as several candles on the one-minute chart may compress into a single order block on the two-minute chart. The same framework can therefore provide several possible execution points inside one larger price leg.
[30:55] Price fills the fair value gap and changes its state of delivery. Once sell-side delivery is being offered, the market can continue matching sell stops beneath old lows and repricing toward an imbalance in discount.
[31:35] I keep my live charts clean because too many annotations can anchor my thinking to one expectation. I want to remain flexible and respond to what price is actually doing rather than forcing the market to satisfy a preconceived narrative.
When I teach, I add annotations afterward so you can see the internal dialogue I was using while watching an otherwise naked chart.
Session Highs and Lows
[32:50] Now consider the key session highs and lows. For London, I use approximately 2:00 a.m. to 5:00 a.m. New York time and monitor the high and low of that period. Those session extremes are important because price will frequently sweep above or below them and create the same liquidity conditions we have been discussing.
[33:20] For New York, focus on approximately 7:00 a.m. to 10:00 a.m. New York time and identify its important highs and lows. Do the same for the Asian period around 7:00 p.m. to 9:00 p.m. These are the times of day where I’m particularly interested in key highs, lows, and any intraday liquidity forming before the 9:30 equities opening.
My normal operating window is approximately 8:30 a.m. to 11:00 a.m., although it can extend to noon.
[33:59] I generally avoid taking new trades after noon New York time because that period can be problematic. For the afternoon session, I would rather wait until approximately 1:30 p.m. and then observe the afternoon trend into 4:00 p.m. Setups frequently appear between approximately 2:00 and 3:00 p.m., although that is outside the primary scope of this mentorship.
[34:33] For a developing student, what I have already given you is enough. Internal range liquidity refers to short-term highs and lows, with stops resting above or below them, or an imbalance located inside a price leg that the market is retracing into.
[35:14] That is all internal range liquidity means. Combined with the market structure shift, this gives you the basic framework you need. Identifying liquidity pools becomes much easier when you repeatedly study historical data around the specific times of day I have given you.
Your homework is to go through E-mini futures intraday charts and find stop hunts that lead to intraday market structure shifts.
[35:52] Log those examples in your study journal with your own annotations. When price moves above an old high or below an old low to run stops, that is the stop hunt. Afterward, look for the market structure shift on the three-, two-, or one-minute chart.
For this study, focus primarily on approximately 8:30 a.m. to noon New York time. The same logic applies whether you are studying the E-mini or Micro E-mini contracts.
[36:27] Work backward through as much historical data as your chart provider allows. The more examples you annotate, the more experience you build. It is simulated or pseudo-experience, but you are training your brain to recognize the recurring signature.
Think of it like learning to track an animal. Before someone shows you what the track looks like, you may not recognize it. Once you have seen enough examples, you know what you are looking for.
[37:26] The framework is intentionally stripped down. There is no Commitment of Traders report, no breaker discussion, and no need to incorporate every other concept. This is not the only way to trade, but it is a deliberately simple framework that developing students should be able to study and recognize.
[38:06] It has very few moving parts: specific times of day, specific highs and lows, liquidity, and the lower-time-frame market structure shift. Annotate the 15-minute chart with your buy-side and sell-side liquidity pools, then drop to the three-, two-, and one-minute charts.
Backtesting does not mean simply drawing boxes and moving on. Study how price delivered.
[38:44] Record how far price moved, how long the move lasted, and how much drawdown a hypothetical position would have experienced. Put those observations into your study journal. Over time you will build a library of examples that you can return to whenever the concepts temporarily feel unclear.
[39:19] Do not interpret your lack of experience as evidence that you cannot learn this. Some students develop the skill faster than others. The process still requires repetition.
[39:49] The work is the backtesting, logging, and accumulation of examples. That is the part many people skip. Looking at two or three days and deciding you are not learning anything is not sufficient.
[40:17] Learning this requires effort, organization, personal responsibility, and patience. A few pages of casual notes are not enough. You need a structured body of historical examples that you have actually studied.
[40:46] Now I want to show the same logic working in a live NASDAQ E-mini example. TradingView is being used for the chart and TD Ameritrade for execution.
Live Fair Value Gap Trade
[41:20] I’m highlighting a bullish fair value gap after a bullish market structure shift. There is also another smaller fair value gap immediately below the highlighted one. I want price to trade down into this area.
[41:54] When two fair value gaps are positioned close together like this, I am willing to sacrifice the first possible entry and let price reach the lower fair value gap. If price trades into that lower gap and then immediately returns into the higher fair value gap, I can enter in the higher gap with the expectation that the lower one will not be revisited.
[42:26] For this specific live trade, I had approximately 3.25% risk in mind. That is not a recommendation for your own risk sizing. I am explaining what I personally had planned for this trade.
A live execution does not guarantee that every future example will behave the same way. You still need confidence built from repeated observation and study.
[43:36] There is also a clear invalidation condition. If price first rallies into the upper target rectangle before trading down into the fair value gap I want to buy, I will abandon the setup. I would rather miss the trade than force a model after its expected sequence has changed.
[44:01] If price reaches the lower fair value gap and then returns into the higher one, leaving a lower wick, I interpret that as price running the lower imbalance and then accumulating inside the higher fair value gap. In this example, I enter using a market order.
[44:52] I had also taken an E-mini S&P trade earlier that was essentially a scratch, finishing around $75 positive. In the NASDAQ trade, the order is filled and the position initially fluctuates slightly above and below the entry.
[45:38] This is where live trading becomes psychologically difficult for inexperienced traders. You feel compelled to stare at the fluctuating P&L. That is the worst thing to focus on.
I am watching the chart instead. Is price continuing to give me visual evidence that it is accumulating rather than breaking lower? I am willing to allow another move into the lower fair value gap, but I do not want price to completely overlap the structure and continue lower.
[46:13] If price completely trades through the structure and continues down, I would close the position rather than simply wait for the protective stop. Notice that the candle bodies are remaining relatively inside the highlighted fair value gap. That is the information I am watching.
[46:48] Once you put the trade on, you have to allow the market to deliver without overreacting to every small fluctuation. Not every minor movement should change your analysis.
[47:51] Before entering, I had already accepted that price might trade slightly below the two small wicks inside the lower fair value gap. Because that possibility was already included in my framework, I am psychologically prepared if it occurs.
That is important: decide what price action you are willing to tolerate before you are emotionally reacting to it while the trade is open.
[48:29] In this trade, the maximum open drawdown was approximately $455, which remained inside the risk I had already defined. When trading competitively, my absolute maximum risk has been around 4.5% per trade, while approximately 3% to 3.5% is generally more comfortable for me.
[49:27] My focus remains on the lower boundary of the target rectangle. That is the low-hanging fruit objective. The ideal move might eventually reach the upper boundary, but while you are developing, do not demand that.
Learn to take the easier target that the market is most likely to give you.
[50:09] Once price reaches that lower target, I flatten the position. The trade closes with approximately $1,190 in profit. The important point is not the dollar amount; it is that the trade was framed around liquidity, market structure, fair value gaps, predefined invalidation, and a low-hanging-fruit objective.
[51:39] Looking back at the one-minute chart, you can see the actual executions overlaid on the same areas identified beforehand. The live execution is simply demonstrating the same logic taught throughout the lesson: liquidity is taken, market structure shifts, price retraces into an imbalance or order block, and the trade is framed toward the nearest logical objective.
[52:13] Until I talk to you on Thursday, be safe.
Full transcriptICT’s words as supplied. Open to read.
[00:17] All right folks, welcome back. All right, so this is the Tuesday, January 25th, 2022 ICT mentorship. On the YouTube channel. All right, so this is the internal range liquidity and market structure shifts lecture. All right, so I gave you homework on the community tab. If you have not been paying attention to that, that's where I'm kind of keeping you abreast as to what you should be expecting next, or something that just comes to mind that I feel like sharing. So this is the link I sent out the other day, and I wanted you to go through this particular chart and look for reasons that provided the market structure shift and the buy side and sell side liquidity.
[01:00] So if you have not done that, please stop the video and do that now. Otherwise, you're cheating yourself of learning opportunity. All right, so here is that chart again, 15-minute time frame on the E-mini NASDAQ 100 futures contract for March delivery. 2022. And take your attention over here, okay? This old low and these relative equal highs— see that old low? Below that is sell stops, and relative equal highs above that is buy stops. Now, you could have used this high here. There's nothing inherently wrong about that, but whenever I see equal highs like this, my— and if it's higher than an old high over here, I'm going to use that.
[01:50] So that way there's a little bit of insight for you for your study journal. The sell-side liquidity, you can see that the market trades down, hits that, runs through it, then rallies all the way back up clearing equal highs. So the buy stops have been taken here. Okay, so at both of these price points here and here, that's the I guess the point at which you'll look for or anticipate a market structure shift. And you don't force it, okay? I see a lot of people try to teach my concepts that'll talk about market structure breaks or shifts, and we'll use that term interchangeably.
[02:29] But for intraday, I want you to think about intraday market structure shifts because it's not necessarily a break in market structure that leads to prolonged multi-day movement. Okay, what do I mean by that? If you see a market structure that's bearish and it's broken to the downside intraday, that may just lead to an intraday price leg that may eventually see that high be taken out in the same day. So that's why I'm using the term market structure shift, not market structure break. For our conversation here on this mentorship, just know that when I'm going to lean on that term market structure break, it means a little bit more in context versus an intraday shift in market structure.
[03:22] Just means that there's likely a downside draw or an upside draw intraday by saying the term shift. Okay, so there's a little bit of semantics there. All right, so we have both of these areas here and here where there would be a likelihood of a market structure shift. Up here, we'd look for a fake run above here. So that fake run above, how do we know it's going to be a market structure shift that's bearish? I get that question a lot, even from mentorship students. What you're looking for is the evidence I'm going to show you here tonight, okay?
[03:59] Forget everything else everybody else says about market structure breaks and shifts and all that stuff. This is it, okay? This is the brass tacks. There's absolutely nothing else that you need to know about it, I promise you. If they add anything to it, it's just because they want to sound and look different. But this is the algorithmic perspective of a market structure shift in today. Now keep this price level in mind, so it's essentially 14,600 and 14,820. We're just eyeballing it, okay? Now dropping all the way down into a 2-minute chart, this is that same particular day.
[04:37] Here's those relative equal highs and this run down here. Okay, if you recall, 14.6 and around that 14.860 or so. Okay, if you look at this market structure without having the levels on your chart, it's easy to get lost in all the quote-unquote noise. The uninitiated— and I know it's going to razz the people that don't care to really learn here— but the uninitiated folks that will watch a video or listen to some of the lectures I'll put out, they're trying to bring something in. They're trying to bring in their preconceived notions and ideas about what they think they understand about markets or technical analysis or something in price action.
[05:33] And I want to kind of like allow you to just put that aside for a moment and just imagine this chart is the first time you looked at price action for the first time. I know it's hard, but kind of like strip away everything else that you want to bring to the conversation. No order block discussion, no breaker, none of that stuff, okay? Supply and demand, Elliott Wave, all that garbage. If you look at this price action here, when we had this low form, right before this low was formed, there's a swing high right there.
[06:07] Now, in the first mentorship video I gave you, I mentioned that high-frequency trading algorithms will use market structure on a 3-minute, 2-minute, and 1-minute chart, many times sub-1 minute. That would be like 45-second, 30-second, 15-second intervals. Okay, what the algorithms are actually doing— and this is also going to correct a lot of people out there because they put out misinformation, it's so nonsensical— but I'm challenging you to go into your charts and see if this is not what's actually going on, because it happens every day.
[06:48] If high-frequency algorithms are operating every single day, then these signatures will be in the chart. Okay, if you look at this short-term high here right before this low formed, when this high is taken out right there on that candle, that's significant only, only if this run down here has traded into sell stops, okay, below an old low of some kind. It could be a, a double bottom, it could be a single low, okay, but it's got to be trading under some retail idea that would be viewed as support.
[07:28] Up here, the same thing, we're trading above highs. So we know that above old highs, a neophyte's perspective will be these are unknown orders. So therefore, that's a flawed perspective on price action. How do you know there's liquidity up there? How do you know there's buy stops up there? It's just logic. It's simple. Look at the chart. Everybody's trying to do something based on some kind of theory, logic, whatever, some system. There's buyers and sellers coming in at all times. They're buying and selling, quote unquote, strength or pressure has absolutely no bearing on where these prices are going to go.
[08:13] I know that may shake individuals that think they know something about the markets. Oh, I have an uncle that used to be on the floor of the Chicago Board of Trade and blah blah blah, the Mercantile Exchange guys say this. I don't care, okay? I don't care what any of those folks say because they didn't design the algorithm. So again, put all those, you know, talking points and everybody else's opinion you've adopted because you probably heard someone else talk about it and you subscribe to their view because it's easier just to do that instead of going and looking at it for yourself.
[08:46] And that's what I'm asking you to do. I'm telling you, this is my personal belief. You're going to see proof of these things in a live account execution. But I want you to see the logic behind it, because if you can see this, you'll be light years ahead of everyone else, and you'll laugh in the face of all these people that are going to tell you you're wasting your time trying to learn this. I promise you, this lesson is going to change a lot for you when this run above these relative equal highs happens right there.
[09:21] You're anticipating a market structure shift. You're not forcing it. You're not trying to get ahead of it, okay? I don't think any of you are going to have the skill set to do that. There are ways to know when to sell short right above that and not even wait for the shift in market structure, just like there's ways to know to be a buyer down here without seeing that short-term high broken, then looking for a buy. Over here, the opposite. See this swing low? Let me go back to this for a second.
[09:53] We have this high on this candle, then we have the candle right after that here, the highest one, and then the lower high of this candle here. So that's a swing high. Very simple little pattern, but it means a lot when it's in the proper context. When this high is broken with this particular candle right there, that is significant only on the basis that we have taken liquidity out of the marketplace. That's it. So when it broke this short-term high, this is more meaningful, and then the market will start to seek buy stops, okay, or buy-side liquidity that would rest above here, here, and here.
[10:36] Now I shared an example of live executions, and I was teaching on the idea of utilizing micros, which are essentially $2 per handle, okay, so, or 50 cents per tick. This chart is NASDAQ E-mini. This would represent $20 per handle, and there's 4 ticks in each handle. There's your $20 per handle, okay. So again, what that means is 14680 to 14681, that's 1 handle or 4 ticks. There are some that will doubt the idea that you can trade all these little internal swings, okay? And I'm going to give you some insights on how I was doing it, okay?
[11:21] The main context of this lesson is for you to go in to your charts and try to prove me wrong, okay? That's the challenge here. That's your homework. I want you to learn what I'm doing in this lesson here, and then you go into your charts backtesting. And I'll show you what that looks like, what does it mean to be backtesting, and what you're looking for, and how you're going to screen capture all those things. But your mission is to go into the charts and look for this not being true, okay?
[11:55] This is exactly what I did on Baby Pips back in 2010. I told everybody, do not take my word for it. Don't take my word for it. Go into the charts and see if this is true or not. I believe it, but I don't want to try to convince you because I won't. You'll convince yourself once you start seeing it. It's it, it's over. There's no argument after that, okay? But it's simple logic, very simple. This is a very clean chart, is it not? All I'm going to do is add a few annotations, and this is about as extensive of lipstick we put on our chart.
[12:31] I know it's shocking, right? Can you still see the candles? Because it might be a little obstructive. I'm being facetious. You see these guys out there with these charts that have graffiti all over it? You can't even see the price candle, nothing. You can't, you can't even see any of it, but there's all kinds of overlays of all kinds of nonsense, which means absolutely nothing because algorithms could care less about any of that stuff. Triangles, harmonic this, Crabs. It's crazy, I know, but hey, everybody's got to have a religion.
[13:03] So here's those sell stops. So this little area here, it's shaded in, that's an area where sell stops would be residing below that 14,600 level, okay, on that 15-minute time frame. So the market dove into that liquidity, and you may or may not know that is a buy. You don't need to. You anticipate a shift in market structure when the market rallies above. When does that happen? On this candle right here. See that little light bulb? That's when you're thinking, okay, now I have a condition in the marketplace that I might see an opportunity intraday.
[13:42] Let's see if there's further evidence to that. Short-term high is taken here. We traded above it. It does not need to close above that. Okay, real important. Once that candle closes and this candle opens, you're going to monitor this candle and you want to see as soon as this candle closes, does it create that fair value gap? If it creates a fair value gap, again, that's a candle with a high, one single pass up, next candle has a low that doesn't completely overlap all this. That's a fair value gap, real simple.
[14:18] Okay, this candle is where you would look to potentially trade at the earliest because now there's a gap there. The market trades down into that, boom, takes off. Here is insight that everybody needs to understand because they're out here running around on YouTube trying to teach order block theory. Order blocks, okay, I invented it, it's mine, no one talked about it before me. And I first mentioned it in 2010 on Baby Pips. Prior to that, 1996, I was only teaching it to people one-on-one in teachings.
[14:50] That's it, okay? You can't find it in books prior to that. It's mine. No one else taught it before me. It is mine. So I'm going to correct all of you today so that way you can teach your people correctly and not hurt them. See these down closed candles? See that? That's all one continuous order block. What's it doing? It's inside that pool of liquidity, sell stops. Where's the open on that series of down close candles? Right here. That's the price level extended out in time.
[15:25] Boom. So inside this fair value gap, this opening price on the order block, that's your buy plus 3 pips or whatever for spread. And that's what you would use for a limit order. Hmm, that's pretty neat, isn't it? Well, price starts to run where? Above the highs where buy stops would be here, above this high here, and above this high here. Now go back and look at the example where this particular day here I put in orders and I was still learning how to use the Thinkorswim platform, and there's a little toggle box where if you toggle it, it'll send your order right to the marketplace.
[16:09] It won't let you review it. And I had put that on to see if it was going to show me any kind of information on the screen, but I didn't take it off. So what happened was I put that on and it was actually an order that I mistakenly had in. So I was hoping to see if it could give me an opportunity to get out of it and cover with next to nothing, or maybe even squeak out a profit. It wasn't having it, so I had to reverse and then go back and go short.
[16:31] Wrote it down, and then you'll see me covering in here and then going long, selling short, reversing, going short, buying long in here inside the order block, rallied up, sold the long, reversed it, bought it here, got out over here, and resold for that big run into that. Okay, that's what I was doing. There's people out there are going to tell you he doesn't trade that way. These people don't know how I'm trading. You have no idea how I'm trading. None of you do, okay? I'm teaching you, obviously, for those individuals that are outside my paid mentorship, which is not open, so please stop emailing asking.
[17:10] People are still sending me emails, can I join? No, you can't join. Be content with this. I'm teaching you gold, and it's costing you nothing but the time to sit down here. And if it doesn't work, you're going to know right away, okay? I'm not wasting your time. I'm going right into the brass tacks. That way, the people that are weak-minded will know right away this is it or it's not. That way, you'll know this is too much work for you, and that's fine. Go and do whatever you got to do, and I wish you good luck.
[17:37] But the individuals that really put the time in and test what I'm challenging you to look for, you're going to see it's there and it repeats like clockwork. Okay, it's real important you have that mindset. So the buy stops above here that was taken. This swing low forms once this candle closes. So this candle we're watching, does it go below that short-term low? It does. So now we have a shift in market structure that is now bearish only because we've taken buy stops. Okay, fair value gap forms, the market rallies up into that, you go short there.
[18:12] What are you looking for? Below here, sell stops. Below here, sell stops. Below here, sell stops. And in this fair value gap here. So if you are in a position that has multiple contracts, or say you have a Forex trade— because this works in Forex too, it's not just limited to futures. Again, I'm just using this asset class because I cut my teeth on these markets when everybody else was still in elementary school that's trying to teach today. I was trading the S&P. Okay, I probably sound like a young guy, but I'm actually getting ready to turn 50, so I've been around for a long time.
[18:50] 30 years this November 5th. 30 years. That's 3 decades. And the things I'm teaching you, I'm not teaching you one-trick pony insight. These things work on all asset classes. Now, I'm not going to co-sign the crypto markets because that— only my students are reporting that this stuff works there. I don't even mess around with it that much. They know, okay? But you can take partials below here. I probably wouldn't do it there, but below here, here. And there's somebody saying, why wouldn't you take them below their ICT?
[19:21] Well, if you're trying to get short here, that's not really that much movement. So if you're going to take something off your trade below that low, why not just try to reach for that one? And you could get it there, right here. Okay, and then below that low is nice as well, below this low. And this is what I mentioned on the first lesson. Okay, elements to a trade setup. This is below the 50 level of this high and that low. Okay, so 50% level, that's what we're targeting.
[19:51] Now this candle's low was the high end or first objective inside this gap, so that's your target. You're going to look for that. So you're looking for low-hanging fruit, the easiest target to get to. You're not trying to be perfect, and you grow into eventually holding to see if it will fill in that gap. Okay, this fair value gap, in other words, going down to this candle's high. That's something that you strive for over time if you understand what I just showed you here. That's a very simple process of looking for, number one, liquidity, gauging what happens without having to know for certain because you don't know You're not going to know until the market shows its hand.
[20:38] This is it showing its hand. Okay, that's it. Now let's go into a 1-minute chart and see how that looks a little bit different but still has the same characteristics. Here's that same price structure just on a 1-minute chart. The same logic's still there, right? Swing high taken after liquidity's been traded into. This short-term high gets violated right when this trades down in here. What's actually occurring? Okay, put this in your notes. High-frequency algorithms are hammering. They're just throwing orders in. Buy, buy, buy, buy, buy.
[21:22] That is not— okay, here's the important thing— that is not causing— okay, it's not causing the market to go higher. It's just volume that's coming in. The algorithms that deliver price, that offer price, that are constantly offering the price in the marketplace, that's what's beginning to spool and go higher. Okay, and regardless of where you want to trade at, your limit orders, they may not get filled. Where you're trying to buy with a market order, you may think you're getting in at 14662, but by the time your order is executed and confirmed, you're in 14664.
[22:07] That's slippage, okay? That's negative slippage. If you were trying to buy it at 14662 and it filled you at 14661, that's positive slippage. That's better than what you were expecting. So when price starts to rally, all this is is a default to the algorithm constantly offering price at a higher price. Okay, and the logic and argument for anyone that wants to say, oh, it's buying selling pressure, this guy has no idea what he's talking about, I know somebody that used to trade on the floor and he's laughing at ICT right now— okay, go into your charts, forget that.
[22:42] I'll, I'll let you have that perspective for a moment for the argument, but go into the charts and see if what I'm not suggesting to you is the truth. Okay, I could sit here and do a complete series on all the things that lead to what I'm saying is true, but none of you will still believe it. I'm showing a live account and entries and executions and they're still doubting it. So no matter what I do, there's going to be people out there, but you didn't do it wearing orange, you didn't do it in your Corvette that you flip, which I don't flip Corvettes.
[23:13] You're getting all kinds of stuff out there, nonsense. But you don't see anybody going into that robin's cup. Hello. So we're looking at the swing lower here. Market breaks down, trades big back up into this, back up in this fair value gap here, and sells off. And there's another fair value gap right there, trades up into that as well. This is a 1-minute chart, so it's giving you multiple points of execution. That you could trade on, and then dives. See these 2 candles here? That's one consecutive bearish order block.
[23:50] The opening price extended out in time. Why is this a good bearish order block? Because it has that gap and it's taking liquidity. And there's a market structure shift. There's your high frequency, high power, high probability bearish order block. Forget everybody else's interpretation of my concept, the order block. That's it. Okay, what is an order block? You didn't— you see a lot of people asking, what is an order block? Only my students and mentorship know what an order block is. Okay, what it is, it's a change in the state of delivery.
[24:30] Okay, it's a change in the state of delivery. The market's being offered Higher, higher, higher, higher in these 2 up-close candles. How did this series of up-close candles begin? With this candle's opening right there. That opening, once this candle trades below it, that changes the state of delivery. So you go back to that point of reference right there, and that's why it's sensitive. The algorithm remembers that right there. Okay, that's all I'm going to give you on the free mentorship level. But that is your answer, okay?
[25:07] That is what an order block is. It is a change in the state of delivery. Much in the same way, all of this movement down here, all these down close candles, the opening on that candle starts this series of delivery on the downside. When that opening price gets violated here, it changes its state of delivery. Now it was offering sell side. When it goes above that opening Now it's offering buy side. What will it be doing after that? It will be looking for buy stops, buy stops, buy stops, because it's offering buy side liquidity.
[25:40] See, you guys don't even know what you're talking about. You're trying to teach my concepts and you have no idea what you're doing. You're talking about things in the left side of the chart. Trade it, do it, okay? You don't even know what you're looking at. And you're hurting the people you call your students. And then right away, when people don't know how to use them or understand what to do with them, they'll say, well, this stuff doesn't work, because they learn from somebody that doesn't know what they're doing.
[26:07] Okay, it's blatantly obvious what it is, but okay, same thing here. Buy side is being offered until that opening price is violated right there. Then the change of state of delivery occurs. Now the market's going to be doing what? Offering sell-side liquidity. What's that mean? It's going to start going lower and attacking the sell stops, all the sell-side liquidity. It's offering it to the marketplace. That's what's happening. That's what the algorithm is doing. That's what the algorithm does, okay? You buying and selling, me buying and selling, everybody over there on Reddit is not going to change anything at all.
[26:44] It's not going to do anything. And the argument that defeats all that buying and selling pressure is how do you argue against the bull squeeze and the bear squeeze? There's a short squeeze going on, the market's rallying up when it's been bearish. That's just their cop-out. That's their way of saying, well, you know, everybody's shorting and now they're covering, so there it is. And I learned the same thing, folks. I believed all that garbage. 2,000+ books, I know What those books told me is what you are learning too, because the same people teaching today retail garbage— Elliott Wave, this and that— it's all stupid stuff, man.
[27:25] It has nothing to do with why these markets are doing what they're doing. Zero. Has nothing to do with it. Don't worry, I got proof today. But the market goes down to that 50% level because it's going down to what I teach you. What did I say in the first video? It's going down from a premium market relative to this low and this high. 50% is here, that's equilibrium. So it's going to go down to a discount, and that's that gap right in here. It doesn't look like a gap so much here, but if we go back up one more time, that's that single opening right there on a 2-minute chart.
[27:59] But then on a 1-minute chart, it's 2 candles that make that up. But you're going to have to do is go through a progression of going from the 3-minute 2-minute and 1-minute chart, and you'll get your market structure and your areas of where it wants to look for an imbalance or old low, old high, and it just makes it easy. But just a real nice delivery there. And here's the lipstick on it on the 1-minute chart. Swing high is broken, market structure is now bullish, rallies.
[28:31] Taking buy stops, taking buy stops, taking buy stops. This right here, these highs right here, it's just staying below that low. It's building up more interest that this is what? Resistance. That is engineering liquidity. That way, when this runs above it, those individuals that know what you're learning today, they know that that's a pool of liquidity for buyers coming in at a high price. Why is that useful? Because smart money that bought down here or here or here or here or here, that's where they sell to high-seeking buyers.
[29:11] It's not hard logic, folks. It's not complicated, okay? It just feels complicated because you see other people trying to teach something and you hear or read in the comments, you're teaching it better than ICT does. No, you don't. No, you're not. You're not doing— you're actually teaching it incorrectly and without the real context of what it is that you're missing. But I get it, you think every down close candle is a bullish order block and up candle is a bearish order block, and that's not the case.
[29:42] Look in here, okay? For the guys that say I did not take trades or I didn't trade this way, you see that gap right there? See that? See that down close candle right there? That's your order block. Boom, buy it right there. What about this right here dropping down? All these candles here are more significant if you look at it on a 2-minute chart. See that? It becomes one order block right in here. Buy it, sell short. Buy it again. We got up into the stops, sell short, reverse, and ride the larger swing down.
[30:23] Don't listen to these yahoos out there that say that I'm not proving something to you. I'm proving it. That's what I said I was going to come out here this year and do. That's this whole point of being here this year. It's my 30th anniversary, November 5th. I've been a trader in the markets, living and breathing this stuff for 30 years. You're not really in any position to demand anything from me. I enjoy doing this, but I don't need to provide any kind of proof to you either.
[30:55] But I'm loving it this year. I'm slowly putting it out there and enjoying all the naysayers and the things they're saying, and it's just fun because they have no idea what I'm about to bring this entire year. None of you are going to doubt anything. So the 1-minute chart, just a real nice delivery here as well, filling in that fair value gap, changing the state of delivery. Now it's offering sell side. What's that mean? It's going to match up sell stops. It's going to keep going below old lows into an imbalance until we get down to a discount.
[31:35] Is that hard? Is it hard to see what I'm showing you here? Pretty clean, isn't it? Clean chart. Now, I don't have all these things on my chart when I'm watching price because I already know what I'm looking for, and I don't want to have any distractions, and I don't want to have a level or some kind of annotation that's going to keep me thinking only with that perspective, okay, or that idea. It allows me to be fluid with what the market's actually doing versus going in and saying, okay, this is what I think is going to happen and this is the only thing that can happen.
[32:12] You understand what I just did there? I allow myself to be flexible, whereas if you have all these things you're putting on your chart, you're only, only seeing your will be done. So I keep my charts clean. And then I add the annotations so that way my students can see what the internal dialogue in my mind was while watching price do what it does naked. There's nothing on the charts at all when I'm trading. Zero. Nothing. Okay, so with that, I want you to think about how this is useful.
[32:50] Okay, number one, you're looking at London highs and lows, the session for London open, okay? For instance, like 2 o'clock in the morning to 5 o'clock in the morning New York time. Every, every time I tell you, just always set it with New York local time. 2 o'clock to 5 o'clock in the morning, that's your London session. What's the highs and lows of that session, okay? That's important because the market's going to probably sweep above those highs or sweep below those lows and create situations like this.
[33:20] Okay, and the New York session is 7 o'clock in the morning to 10 o'clock in the morning, New York local time. Okay, what's the session high and low for that? And do the same thing for Asia. Okay, 7 PM to 9 PM. And that's it. Those are the 3 times of the day that I'm looking for specific key highs and key lows and any intraday high and low forming right before the equities open at 9:30. Pretty easy, right? The hours of operation again are generally between 8:30 in the morning to 11, but it can be extended all the way to New York lunch, noon.
[33:59] I do not tend to take trades after noon local time New York. That hour is usually very problematic, and it just— it's better not to even look for any kind of setups. Wait until 1 o'clock, preferably really 1:30 to 4 o'clock, then you got the afternoon trend. Typically you'll see between 2 o'clock and 3 o'clock there's a setup that usually forms in the afternoon trend, or set up in that period of time of the day that will also offer opportunities. But that's outside the scope of what I'm going to be teaching in this mentorship.
[34:33] But there's lots of things you can look on YouTube about the afternoon session, and you can just combine some of the things that I'm going to teach you here. And just, it's not hard to make a, you know, an addition to what you're learning here. So that way, if you want to trade the afternoon session, you can obviously pick up some insights from other YouTubers that do trade futures. But for developing students, this is enough. I promise you this is enough. Okay, all right, so we talked about internal range liquidity, and internal range liquidity is looking for short-term lows or short-term highs inside a price leg that we're retracing back into.
[35:14] Okay, that's all it means. Internal range liquidity is a short-term higher low with stops above or below it, or an imbalance in that same range of price action. And I taught you market structure shifts, showed you exactly all that's necessary. That is all that you require. And the skill set of identifying pools of liquidity That is going to be something you learn rather quickly just by going through old data and looking at the times of the day I gave you in this lecture. All right, your homework is you're going to go through your E-mini futures intraday charts and you'll be looking for stop hunts that lead to market structure shifts intraday.
[35:52] You're going to log your examples with your own annotations for your study journal. So what I showed with the break in the market going higher and lower above old highs or lower below an old low, that's running for stops. That's a stop hunt. Then you're looking for that signature for the market structure shift on the 3, 2, and/or 1-minute charts. Okay, if you look for that between 8:30 in the morning to noon New York local time in the E-mini markets, or if you're watching the micro markets, the same logic exists.
[36:27] Okay, but you're going to start going back from today and go back as far as the data will allow you. The more you do it and you annotate your charts, the more experience you're going to have. And it's pseudo-experience, yes, but you're teaching your brain. I use this analogy a lot with my paid mentorship students. It's like hunters, okay? To know where you're gonna find a deer, if that's what you're going to go out and hunt, you need to know how to track one, okay? Or sit up in a tree stand and wait for them to walk by.
[36:58] But usually they go out and they walk around in the woods and look for tracks. Would you know what a deer track looks like? Before I was shown one, I didn't know what it was, okay? But because I'm showing you what it looks like, that's all this lesson was predominantly focusing on, is the actual view of what it looks like, the details. What you don't need is anything above and beyond what I've shown you. The only thing that you need is what I've shown you here.
[37:26] It's simple. It's straight to the point, and I'm only talking so that way you understand that this is all that is required. Notice there is no commitment of traders. Notice there's no breakers. Notice that I've stripped it down to the chrome. Now, this isn't the only way you can trade, but I'm showing you something that I think personally— this is my opinion— this is so universally simplistic, all of you should be able to do this one. Okay, in my opinion, I think this is it, and that's why I more or less built it, because I think my daughter, which has zero interest in trading, I think that this is going to be easy for her to see it and understand what to look for.
[38:06] It doesn't have a lot of moving parts. You notice that it's very specific times of the day, specific highs and lows you're going to look for. It's simple, but you won't appreciate how simple it is until you go back in your charts And you annotate your 15-minute time frame for your buy side liquidity pool and your sell side liquidity pools, and then going down into the 3-minute, 2-minute, and 1-minute chart. So for every individual day that you're logging and you're backtesting— backtesting is just dressing your chart up like I'm showing you here and then studying it, not just do it and say, okay, I'm done— really go into to see how price moved and how it delivered.
[38:44] How many pips did it move? How long did it move going higher or lower? How much drawdown did it put on your position if you would have taken one? All those things you want to annotate that in your chart so that way when you go back through your study journal, you'll have many examples to look at. And because you're looking at it and you're seeing it over and over again repetitively, when you have a period of time where or nothing feels like it's working and you feel confused, you want to go back through your study journal and look at these examples because it will encourage you through periods of time where you just feel like it isn't clicking.
[39:19] Okay, it's why it's important to have a study journal because you're going to see this stuff is happening every single day, every single day. And don't take the infancy that you have right now and the lack of experience and amplify that to there's no way I can learn how to do this because because that's a lie, that's a facade. Don't buy into that view, okay? It's something that you're going to have to grow into, and it's going to be quick for some and it's going to be slower for others.
[39:49] And there's no way I can make it easier than this, okay? Because that workload that you have to go through of backtesting and logging and acquiring examples— the more time you do that, the more examples you acquire in backtesting. I swear, this is the secret. Okay, because that is the thing, that's the work that's required. A lot of people say they do it, but they don't. Okay, they go back a couple days and say, oh, this is— I don't feel like I'm getting anything from this.
[40:17] But that's the reason why they fail, because that's the work that's required. You know, having 10 pages in a notebook saying I took notes— you didn't take notes, you scribbled. You wasted your time. You knew going in you weren't going to be that headstrong about doing it, and that's what is required to learn this. Otherwise, if you don't have that mindset, this isn't going to be for you because it's going to require work. It's going to take effort and organization and personal responsibility. If you don't have those characteristics, you need to develop them.
[40:46] If you don't develop them— and patience— you might as well go out there and find somebody that's good at giving you trade signals and just submit to that and you good luck with it. But this isn't it. I got another portion of the video I want to show you now, and I'm going to show you this logic actually working today in the NASDAQ E-mini contract. All right, so we're looking at TradingView's chart in the backdrop, and I have the TD Ameritrade open over top of it, scrunched down so that way I can operate with the TradingView.
[41:20] And I'm going to highlight in TradingView a fair value gap after a market structure shift that's bullish. And I'm going to show you an imbalance that is in a premium. Okay, you see that? Just the opposite of what I've been showing you. Change the color on this. And the idea is I want to see it drop down into that green area. But if you look real close, there's actually a smaller little fair value gap just below that green box. Okay, this is not supply and demand.
[41:54] Okay, the idea is I want to see it drop down to that green box, and I don't know if it's going to dip into the lower fair value gap. So whenever there's 2 fair value gaps like this— this is for your notes in case you missed this— the idea is I'm going to let it trade down to that lower one. I'll sacrifice that better entry, and if it trades down there and trades into it and then comes right back up into that green box, the first higher fair value gap, I'll enter when it's in there and expect that the lower one won't be retraded to.
[42:26] Okay, I'm gonna be trading with a stop that will have essentially 3.25% risk. I'm not suggesting that's a size of risk for you, I'm just telling you that's what I have in mind when I'm taking this trade. And this is again just my personal belief in this. I'm not suggesting that you should believe me or, you know, subscribe to this view because I'm showing you a live account. This does not mean that every trade you take forward from this day on is going to be like this.
[42:59] It doesn't mean it guarantees profit. It doesn't. But my belief and my faith is that I've seen this work so many times over the last 30 years that I know that this is something that's going to work. Enough for me, and that's all that matters. It's a personal endeavor, you know, when you're speculating. If you don't have any faith in it, then obviously you would never put live money in it. All right, so the market's starting to drop down a little bit in here, and let's say for instance that it runs up into that upper rectangle first before going down to the green one.
[43:36] Then I would nix the trade, and that means I wouldn't take a trade and I would move to the sidelines and probably do nothing the rest of the morning, or watch and see if there's something else that sets up. All right, so now I'm inside that rectangle, but notice again, I want to see if it goes down to that lower fair value gap that's not highlighted. I'll mention it when we get into it. That right there, I'm willing to sacrifice that because that's actually the better buy.
[44:01] But if we go back up into the higher fair value gap and create like a tail on this particular candle, I'll see that as just running for a lower imbalance, and then it should accumulate in here. And I have my trigger on the buy button. Okay, I'm just going to go in with a buy at market. I'm not trying to do anything advanced here. Okay, and if you look at the bottom of the TD Ameritrade live account module, you'll see the NASDAQ symbol and you'll actually see my profit and loss going as the trade is entered.
[44:52] And I took a trade in the E-mini S&P and it was basically a scratch. Ended up making $75. So I put a trade on and came back on me, stopped me, and that was the end of that. All right, there I am putting the order in and there's the confirmation that the orders were Received. So now I'm long. You can see at the bottom of the pop-out it shows that I'm down initially what looks like $20, and I'm up $20 right now. So now down $75.
[45:38] So this is the part of trading where it feels scary if you've never traded with live funds and you just feel like you got to watch that number of how much money you're making and losing. That's the worst thing to do, okay? What I'm watching is the chart. Does the chart continuously keep giving me feedback visually that it's accumulating and not going lower? Now, it can go one more time back into that lower fair value gap. That's permissible to me. I'm willing to endure that. I just don't want to see it overlap that entire thing.
[46:13] And go lower, because then I'd have to close the trade and preferably save my stop. Notice the bodies of the candles are staying relatively inside that fair value gap that's shaded green. Now, I— again, I'm only adding this to the chart because I knew I was going to record it and share it with you today, but I do not have this in my charts, okay? The only annotations I have in my charts is when I'm teaching my students. And since you're here, at least for right now, I'm calling you my student, even the haters.
[46:48] All right, so with the aid of hindsight, because I lived this moment this morning, it does go down one more time and stab into those wicks that are forming. Now when you put a trade on, you kind of like give the complete control of everything to the marketplace, and you want to just allow the market to do what it's going to do and not try to overthink every fluctuation. Every little minor movement in the price action is not something that is going to hopefully sway you.
[47:51] So I've already had it in my mind that it could go back down and make a slightly lower low than those 2 little wicks that it's formed inside the lower fair value gap. So since I had that expectation that it could potentially do that, I'm desensitizing myself to that in the event that it forms. An ideal scenario would be it doesn't do it at all, obviously, but I'm allowing for that price action, especially with the volatility that we've been seeing the last few days. And what I'm thinking right now is they're taking it down one more time to accumulate more longs.
[48:29] Notice I'm saying that, not it's selling pressure driving price down. I think this, uh, this is where I took the most heat on the trade, if I'm not mistaken. I think It's like $455 of trade drawdown while being still in the trade, which is below the threshold I've already said. My maximum risk on a trade if I'm trading competitively, it's 4.5% per trade. Generally, I like to take a trade that I feel comfortable with around 3, 3.5%. That's a good trade for me. Okay, showing signs initially that it's wanting to go higher.
[49:27] And what I'm trying to do is keep my focus on that lower level, or the, the bottom of that pink rectangle. That's the low-hanging fruit. That's the easy target I'm telling you to try to practice and learn to reach for. The ideal scenario would be to go all the way to the top of that pink But while you're learning, don't do that, okay? It's easier just to let it trade to the low end and just take it off when it gives it to you. I have my trigger on the flatten button, so it cancels every order, takes me completely out of the marketplace as soon as it touches the low end of that rectangle.
[50:09] I'll collapse the trade. Right now I'm up $7,900, almost $900, $895, $935, $925. Again, you can watch that fluctuation in the lower right-hand corner of the pop-out. I'm at $1,100 plus, $1,149. Okay, traded there. Touched it. Now I'm collapsing the trade there just like that, and that's it. Now my account's booked and marked to market with $1,190 in gain, and the balance now reflects it with $27,915.11. So there's TradingView showing the chart I'm watching because I like TradingView's charts. I don't like TD Ameritrade charts. It's— I don't like them.
[51:01] So I'm just using the pop-out, which is— why are you showing this thing scrunched up? You're just— I'm not hiding anything. You can see it, it's right there. So let's go over and take a look at the chart now. You can see nothing has changed. I just magnified that pop-out so it's entirely taking up my entire screen. We're going to go to the NASDAQ E-mini contract symbol And I am so clumsy with this platform still, but I'm sure I'll get real good at it by the middle of the year.
[51:39] Hint hint, nudge nudge. All right, so we're gonna look at this day, and there's the chart on 1 minute, and I'm going to add an overlay. Okay, but I'm going to put in so you can see where the trades are. In that chart. There's the executions, bada bing bada boom. And there is these areas I showed you on the TradingView chart. So for the inquiring minds that wanted to see a live chart and live account and all that business, and the logic of what I'm teaching in the YouTube channel, I humbly submit this.
[52:13] Until I talk to you on Thursday, be safe.
Take the lesson to your next session.
Plan it on the clock, file the chart where it happened, and see whether the setup actually repeats.