
2022 ICT Mentorship Episode 2
\[26:23\] After the buy-side liquidity has been raided on the higher time frame, drop to the lower time frames and look for a specific entry signature.
Date: 2022-01-22
[00:46] This first installment is about the elements of a trade setup. The mentorship will focus predominantly on index futures, especially NASDAQ E-mini futures, with the concepts studied through paper trading and historical price action rather than live funds.
[01:34] NASDAQ is faster and more aggressive than the E-mini S&P or Dow, but the same underlying principles apply across all three markets. The objective is to learn how to watch price action and understand what it is likely to do before it does it.
[03:33] When you look at an intraday chart, don’t begin by trying to capture every move. Ask yourself which price leg stands out most clearly. The goal is not to buy, sell short, reverse, and capture every fluctuation. The goal is to identify one meaningful intraday price leg and understand the framework that produced it.
[04:08] In index futures, one handle equals four ticks. NASDAQ pays $20 per handle on the full-size contract and moves more aggressively than the other index futures. Micro contracts reduce the tick value and leverage, making them more appropriate for practicing the concepts while you develop skill.
[08:55] A framework is the foundation of a trading model. You need to understand what you’re looking for before you can recognize it consistently. Once you understand the rules and practice the process, you should be able to find these setups independently from the chart itself.
[11:55] The primary focus is finding one clean intraday price leg. I’m not promising that you’ll capture every directional change throughout the session. I’m teaching you how to identify a specific setup that can produce a meaningful move.
[12:32] We begin on the weekly chart. Before the new trading week starts, preferably over the weekend, determine whether the next weekly candle is more likely to expand higher or lower. You are not trying to predict where the weekly candle will close. You only want a directional expectation for its expansion.
[13:14] In this example, we were looking for lower prices. Seasonality was bearish, the Federal Reserve was discussing interest-rate increases, and earnings season was producing additional volatility. More importantly, the underlying tone of price action was heavy.
[14:17]* I did not need the entire downside range to be delivered in one week. I only needed the expectation that the weekly candle was likely to expand lower and gravitate toward this old low.*
That is the first component of the analysis: what is the market likely drawing toward?[14:47] Think of price as a paper clip being pulled by a magnet. Specific price levels, liquidity pools, imbalances, and seasonal tendencies can create that magnetic draw. The speed and magnitude of the move toward those levels are learned through observation and experience.
[15:29]* In the early stages of your development, focus on the likely direction of the weekly candle. The move may occur during the first half of the week or during one particular session. If you get a valid setup during that expansion, that may be the only trade you need.*
Do not build an expectation that you must trade every session or every day. That mindset makes the first losing trade feel like something that must be corrected immediately, which leads to irrational decisions and the loser cycle.[16:06] The weekly expectation establishes your initial bias. Then move to the daily chart and study swing highs and swing lows to identify liquidity and determine where price is likely drawing.
Most of your analysis should be linked to the daily chart. If the weekly expectation is lower, you want to identify short-term lows with sell stops resting beneath them.
[17:27] Price is generally drawing toward one of two things: liquidity or imbalance. Buy stops rest above old highs, and sell stops rest below old lows.
An imbalance occurs when price delivers aggressively in one direction without overlapping price action in the opposite direction. For example, if the previous candle’s high is below the next candle’s low, the space between them represents a one-sided delivery that may later need to be rebalanced.[19:05] After establishing the weekly and daily expectations, drop to the hourly chart. In this example, the market sold off during the week and then consolidated overnight. The old daily low below remained the larger draw.
[20:22] The week had been bearish, followed by consolidation. That consolidation created a short-term high and a short-term low. Buy stops rested above the high, and sell stops rested below the low.
Price initially traded lower and took the sell stops beneath the range.
[21:00] That initial downside break induced traders to sell short. Price then reversed against them and began moving toward the buy stops above the short-term high.
When price traded above that high, the buy stops became market orders. That created willing buyers at a high price, providing the counterparty for smart money that wanted to sell short.
[22:14] When a significant move lower is expected, anticipate some measure of a stop raid above a short-term high or pool of buy-side liquidity before the decline begins. The opposite applies when higher prices are expected: price will often raid sell stops below a short-term low before rallying.
[23:20] On the 15-minute chart, mark the relevant high and low of the consolidation. These annotations help you maintain your bearings while price is moving and keep your attention on the liquidity pools.
Price first attacks sell-side liquidity beneath the range, inducing breakout traders to go short. It then rallies toward the relative equal highs above.
[24:22] Retail traders often see relative equal highs as resistance and place protective buy stops just above them. Those stops become a target.
Before an important directional move, the market will frequently conduct a stop raid in the opposite direction of the anticipated expansion.
[25:21] The larger pool of liquidity was above the relative equal highs because it was aligned with traders already short from the previous decline. Once the market broke below the consolidation low, many of those traders moved their stop losses above the most recent short-term high.
That made the buy-side liquidity above the range even more attractive.
[26:23] After the buy-side liquidity has been raided on the higher time frame, drop to the lower time frames and look for a specific entry signature. For index futures, the one-, two-, and three-minute charts generally offer the clearest view of the small imbalances used for execution.
[27:38] Price runs through the buy stops, forms a short-term low, and then breaks below that low. That is a break in market structure.
The broader framework is already bearish: the weekly candle is expected to expand lower, the market has been declining all week, consolidation has engineered liquidity, sell-side was taken first, and then buy-side liquidity was raided. Only after that context is established do we look for the lower-time-frame entry.
[29:17] Once the short-term low is broken, identify the imbalance created by the displacement lower. Price can retrace into that imbalance, and that retracement becomes the short entry.
If you do not get the entry on the current chart, you can move to a lower time frame and look for the same pattern to form inside the larger imbalance.
[29:40] Highlight the low of the candle before the displacement and the high of the candle after it. The space between those two prices is the fair value gap.
Once price retraces into that fair value gap, the setup is offering a short entry.
[31:05] Do not rush to trade the pattern simply because you have seen it once. You need weeks and months of backtesting to build trust in the framework and correct the personal weaknesses that appear during execution.
Focus on the imbalance that forms after the market structure break. These are the fingerprints of the setup, and they repeat.
[31:59] Here the displacement candle breaks the short-term low. The next candle opens, trades higher, and retraces into the fair value gap. As soon as price enters that imbalance, the short can be executed.
[32:31] The stop can be placed above the swing high or above the high of the entry candle, depending on your risk parameters. The full-size NASDAQ contract can move very quickly, which is why newer traders should practice with paper trading or the micro contract while developing the skill to navigate the market.
[33:30] If price begins moving lower before you enter, you can still participate while it remains close to the original fair value gap. Once price has already broken another low and expanded away from the entry array, entering becomes chasing.
A market order after the move has already reached the low can suffer slippage and force you to accept unnecessary risk.
[34:27] You must learn to sell short while price is retracing higher into the entry array. That feels uncomfortable at first because retail traders are taught to wait for confirmation, which usually means entering late.
Momentum entries beneath the market can work in fast conditions, but they can be damaging when the market is consolidating or preparing to reverse.
[35:23] After establishing the entry, use the liquidity matrix to frame the objective. Take the current low of the day and high of the day and divide the range at its midpoint. A Fibonacci tool with only the 50% level is sufficient.
Anything above the midpoint is premium, and anything below it is discount.
[35:56] If you are bearish and looking to sell short, you want the entry to form in the premium portion of the range. From there, the algorithm can reprice toward the discount side.
Markets can remain in premium or discount for extended periods, but the framework gives you a way to determine where your entry is situated within the current dealing range.
[37:29] Below the midpoint, identify the nearest sell-side liquidity or imbalance. Traders who are short must eventually buy back their positions, so the sell stops resting beneath an old low provide willing sellers at a lower price.
In this example, sell stops were resting beneath the low, and an old imbalance was positioned in the same area.
[38:07] Price moved from the premium fair value gap, passed below the midpoint, attacked the sell stops, and completely rebalanced the old buy-side imbalance.
The original move through that area had delivered price only upward. The later downside movement provided the opposing delivery and efficiently rebalanced the range.
[39:20] That completed the trade framework. Although the larger daily low remained a potential draw, there was no need to demand that entire move. You will always leave something on the table. Sometimes you will enter too early, exit too early, hold too long, or use less size than you later wish you had.
Do not undermine a well-executed trade by criticizing everything you failed to capture.
[40:17] This framework repeats every week. The objective is not a small five- or ten-handle scalp. A single well-framed setup can produce a much larger intraday price leg.
That does not mean every setup will deliver the same magnitude. It means the structure can position you for moves that are large enough to matter without requiring constant high-frequency trading.
[41:34] You will not recognize these setups consistently merely by sitting in front of the chart. Study historical examples and observe live price action whenever possible. TradingView’s replay function can help you practice how price moves toward liquidity and imbalance, even though it cannot perfectly reproduce live candle formation.
[42:44] For index futures, the period from approximately 8:30 a.m. to 11:00 a.m. New York time frequently provides useful setups. The important point is not the time window by itself, but the recurring elements inside it.
[43:13] If you are bearish, look for a run on buy-side liquidity, followed by a break in market structure lower. The break should occur beneath a clearly defined short-term swing low and ideally create a fair value gap.
When price retraces into that gap, you can sell short. A more conservative entry can use a sell stop beneath the retracement candle, with the stop above its high, although that may require a wider risk allowance.
[44:11] When you study these setups repeatedly and combine them with sound money management, you will see that you do not need to survive on tiny price movements. The advantage comes from aligning the higher-time-frame draw, the liquidity raid, the market structure break, the fair value gap entry, and the opposing liquidity objective.
[46:04] Your homework is to review the E-mini index futures charts across the time frames used in this lesson. Study intraday data and look for breaks in market structure that occur after a pool of liquidity has been taken in the direction opposite your weekly expectation.
[47:29] If you expect the weekly range to expand lower, focus on a run above an old high. After buy-side liquidity is taken, move to a lower time frame and look for a break in market structure. If that displacement creates an imbalance, the retracement into that fair value gap becomes the trigger.
Then divide the current range at its midpoint and identify the nearest opposing low or imbalance as the objective.
[48:08] Use the closest logical target. Do not demand the lowest low on the chart simply because it is available. Low-hanging fruit is the easier, nearer objective. Allow price to continue beyond it without you.
[48:39] Log each historical example in your journal. Record the higher-time-frame expectation, the liquidity pool that was raided, the market structure break, the fair value gap, the entry, the opposing liquidity or imbalance used as the target, and the number of handles the setup delivered.
Build a collection of examples until the framework becomes familiar and repeatable.
Full transcriptICT’s words · expand to read the supplied transcript
[00:12] All right folks, well, we're here. So technically this is the first teaching. I gave you guys an introduction video, obviously. If you haven't watched that one yet, go to the playlist on my YouTube channel. And please watch that one because it'll help at least establish the, in my opinion, the proper expectations. That way you understand what you're getting involved with here, and at least it gives me a chance to kind of like break the ice and show you the contrast of what you may be expecting versus what I intend to deliver.
[00:46] All right, so this first installment is going to be elements to a trade setup. All right, so coming out of the gate, I just want to let you know that this is predominantly going to be a futures index trading mentorship. Okay, the idea is going to be presented in the scope of paper trading on tradingview.com, but what you're looking at here This is Thinkorswim's live data. These are actual executions I made today, and I want you to compare and contrast with what you see on YouTube and other educators where they'll tout that they can do this and they can do that.
[01:34] But really, I want you to compare and contrast what you see here. All right, so we're looking at intraday price action for NASDAQ E-mini futures. And this is actually the, the main focus of this mentorship, okay? I believe that this market is worth studying. I believe it is not just limited to NASDAQ, but I believe it's useful to learn as a trader that views obviously the E-mini S&P the E-mini Dow future and the E-mini NASDAQ. Now, E-mini NASDAQ is a little bit faster, a little bit more aggressive, and even with that you can still trade it.
[02:22] So I want you to think about what it means to watch price action and understand what it's likely to do before it does it. Now, I'm not promising you're gonna be able to do that right out of the gate. What I'm going to show you is the compare and contrast to how I can trade versus what I'm promising to teach you in this mentorship— how to find specific setups in your demo account, okay, or your paper trading account. I'm not trying to entice you to trade with live funds, okay?
[02:53] So that way we know this going in. The teachings will be predominantly through the scope of tradingview.com's paper trading module, or just hindsight data. Now I already know some of you are, oh, here we go, the hindsight guy. Well, what you're looking at here is actually live executions from today, okay? And I want you to think about if you were able to trade a micro account and you were trading the NASDAQ and you were able to capture just one of these moves, which one would you like to learn how to find?
[03:33] Obviously, you'd probably look at this and think, well, I'd like to do all of them, but I want you to think about which one really stands out off the entire chart. And this is a 1-minute chart. Which one really stands out? And I'll give you a moment. You can pause the video and unpause it when you're ready. Some of you folks never ever pause it. All right, so obviously we can see how the market moves from here. Okay, 2 orders executed here. Whenever you see this, this is actually a reversal.
[04:08] So if there is a trade on long, it'll reverse and take you the other direction. Okay, and then this one here, this is a reversal as well. Then another close and then another long entry, the exit, a short entry, and then the COVID Okay, I'd like for you to consider what it would take for you to find consistency and how many handles, how many full handle moves in an index futures contract that would satisfy you. When I say a handle, that's essentially 4 ticks, the minimum fluctuation in these markets.
[04:49] An example would be if you were trading the E-mini S&P and you were trading obviously the 4450 level and you went long. If it went to 4451, that's a full handle, okay, or 4 ticks, or 4 times $12.50, or $50 per handle. The NASDAQ is $20 per handle, so it's slightly different, but it's faster. It moves a lot more. A lot more handles, a lot more aggression. Now it doesn't always move faster. Sometimes we'll have a lethargic price action in this indices or another out of the 3.
[05:29] That would be the S&P, the NASDAQ, and the Dow. I personally don't trade the Dow that much, but there's a lot of my students that love trading the YM. But YM is the symbol for the futures contract. And these 3 markets have the luxury for you that may not have the capability to put up to like $17,000 margin if you were going to trade one full contract of the NASDAQ futures. Most brokers, unless you're using a discount broker, they're going to require you to have deep pockets in the sense that you're going to have to have about $17,000 and about $12,500 for an E-mini S&P full futures contract, okay?
[06:07] You take basically a fraction of that and you can trade a micro on each one of these markets. But obviously it reduces the number of the tick multiplier because you're trading with a lot less technically leverage. So I'm going to get into all that, but I just kind of like want to begin the conversation informally, but also that's kind of like show you what it is that I do versus what other people do. Okay, so I'm not trying to, you know, point my finger at anyone in particular, but if you look around on YouTube, there are people out there that try to make a big stink about themselves, and they'll try to show results that may or may not be real.
[06:59] I'm not here to disparage that. They could be actually trading a live account. I don't personally care, but anyone that trades on Thinkorswim, they can recognize this chart right away. I posted a results and updated reflection on the Thinkorswim or TD Ameritrade account, and it's on my community tab. I promise I won't beat you up too much with the community tab, but that's my way of reaching out to you. So if you subscribe to the channel And then when you subscribe to the channel, you want to toggle all notifications.
[07:31] You want to click that little, uh, I think it's like a bell icon, and then all notifications. That way anytime I post on my community tab, it'll let you know. Otherwise it won't let you know. So it's, it's my replacement to Twitter, which in my opinion sucks. So if we look at the ebb and flow of all this here where the market's trading up, and between here and here, it's not a small number of handles. It's a pretty respectful amount of handles. It's not a couple, it's not a handful.
[08:08] And then up here, it's a reversal, and then it comes back down, and I buy it back here in reverse. So I'm selling short here and I'm buying long here. 740 to 720, that's 20 handles. Going long here at 720— I'm abbreviating the number just for brevity's sake— getting out at 732, 12 handles. Then going along here, 756, and then getting out at 784.5. Then going short at 798 and covering at 675. So I'll ask you, which one of these trades do you think is the one that you want to learn?
[08:55] Again, putting all aside the idea that you probably want to do all of these, but I'm not promising you that, okay? I'm going to take you into how to find this setup here. Notice the number of handles. I'm not promising you're gonna get this many handles, but the setups and the logic behind it will help you find these types of frameworks. Framework is the foundation to a trading model, so you have to have an understanding what it is you're looking for. And that's really the only thing I'm introducing tonight, is the idea of what it is I'm promising to educate you with so that way you can go in and find these setups on your own.
[09:36] You will not need to be a slave to some kind of black box system. You don't need to be a part of some kind of signal generating gimmick. You don't need to be a part of a signal service. You can find these on your own, independent. That's exactly what I'm trying to frame in all of my students. I do that with my mentorship students that paid me for education. Now here you are in my YouTube channel, I'm telling you the same thing. I'm teaching independence. That way you're not requiring any hand-holding by me.
[10:07] Once you understand the rules and you go through the processes and things I'm going to teach you how to practice with, you will not need anything except for the chart itself. That's it. And that's how, in my opinion— and you can argue with this if you want, but I could care less if you could— any of you would challenge the idea that independent thinking is not the best way of doing it. You want to be able to be unshackled, okay? And if you're part of a signal service, or if you're part of a, a approach that requires you to use a black box system, you're kind of held captive, aren't you?
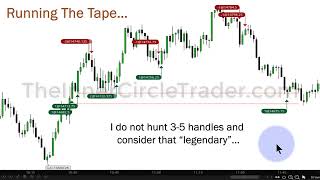
[10:41] So if you look at this, this chart is clean except for these little bubbles actually show you the transactions. You don't really get any kind of, well, distortion from your reading of price action. I don't have a lot of graffiti on the chart, okay? But the main takeaway here is I want you to understand that I don't hunt for 3 to 5 handles and consider that legendary, okay? Now, can you be profitable if you take high-frequency trades and you do those types of trades? Absolutely. That's what algos do.
Keep learning with us.
Get new ICT lessons, study notes and updates as we build V2.