
The Week In The Life Cycle Of Price
This is how I identify pools of liquidity, decide which ones matter, distinguish the stronger ones, and determine which highs and lows I can safely ignore.
Date: 2026-08-15
Loading post from X…
A preserved copy is ready if the original cannot load.
Good morning, folks.
Welcome back, and a pleasant Saturday to you.
As you can see, the market is closed, and I've received a lot of questions.
I've spent enough of my own time to save you a lifetime.
So today I want to cover a topical study: A Week in the Life Cycle of Price.
This is the Saturday weekend lecture for August 15, 2026.
What you're looking at is the weekly chart of the NASDAQ Composite Index using the continuous contract.
I'm going to answer a number of the questions you've sent me.
Some I'll address directly and call out specifically.
Others will be answered naturally as we work through the material—you'll realize your question has been answered simply by following along.
Just know that my analysis always begins with the continuous contract.
I actually start with the monthly chart, but I don't need to do that today because I'm going to mark the monthly highs and monthly lows for you, which will make this easier to follow.
So, what you're looking at here is the NASDAQ Composite Index continuous contract on the weekly time frame.
As you can see here, the high of July is represented by this weekly candle, and the low of July is represented by the low of this candlestick.
Once I have that range defined, I use the continuous contract as my primary reference.
Then I compare it to the current front-month contract.
For example, if we're trading the September NQ futures contract, I want to know whether it agrees with the levels derived from the continuous contract.
The continuous contract gives me a broader frame of reference for key highs, key lows, inefficiencies, and PD Arrays that may not even exist on the front-month contract because of contract rollovers.
That's where the continuous contract becomes so valuable.
The front-month contract eventually expires.
It only begins trading at a certain point, so it doesn't provide the same historical context that the continuous contract does.
For example, contracts like March 2027 or December have no influence on the current composite chart of the continuous contract.
By referring back to historical price data on the continuous contract, I can identify things the average trader simply isn't looking at.
There are times when I go into this extensively.
Go back and review the lectures in the 2026 Lecture Notes playlist on my YouTube channel.
I cover specific things I'm looking for that can only be derived from a continuous contract chart, not simply from the front-month or nearby futures contract being traded.
If you're a CFD trader—in other words, if you're outside the U.S. futures markets—you'll use the same concept.
You'll simply use the continuous contract as your reference, then blend it with the actual highs and lows of the individual days or weeks.
From there, look for the closest corresponding highs and lows on your US100 CFD weekly chart.
Everything I'm showing you here works in Forex. Everything works in gold. Everything works in commodities. It works in bonds. It works in virtually any market.
Whether you're trading CFDs or futures contracts, it doesn't matter. The concepts are the same.
What I'm giving you today is a workshop that compresses the entire process into about half an hour.
This is how I develop a bias.
This is how I determine where I think the market is likely to go after the 9:30 a.m. Eastern Time Regular Trading Hours open.
This is how I identify pools of liquidity, decide which ones matter, distinguish the stronger ones, and determine which highs and lows I can safely ignore.
Obviously, I teach you to use those levels as objectives when reading price going forward.
They're part of the targeting process.
But what happens when there are relative equal highs sitting there?
When do I ignore them?
All of those questions are going to be answered in this lecture.
And just because I'm compressing everything into a short amount of time, don't assume there's less to it.
The difference comes from experience. You'll see what I mean.
So we have a range defined by July's high and low.
It's not complicated, is it? No, it isn't.
Now we're going to zoom in on the weekly chart.
Here we have the previous week's high—right here—and the previous week's low.
Again, we're still working with the continuous contract.
By defining these levels, we've already established a great deal of useful information.
We're now inside a new week. Price opened right here.
So where do you think the market is most likely to go?
If we opened on Sunday and price is sitting here at the start of the week we just closed, what's the higher-probability draw?
This is where bias comes from.
This is where directional conviction comes from.
How do you determine the draw on liquidity?
How do you become so accurate at identifying where the market is likely to draw next?
If we're opening here, is it more likely that price will reach the previous week's high or the previous month's high, or travel all the way down to the previous week's low or previous month's low?
Clearly, the upside objectives are closer.
So, all else being equal, the path of least resistance is higher.
It's also part of a primary bullish market, and they continue to support it.
You can argue about why, but in my view it's artificial.
The market shouldn't even be trading at these levels. The economy isn't strong. There's plenty of fear and uncertainty around committing large amounts of capital given the current administration and everything surrounding it. I believe the fundamental data is unreliable.
So rather than relying on that narrative, I stick with what price is actually showing me.
Until proven otherwise, the market remains bullish.
We have to respect that bullish order flow. It continues to press higher.
So, coming into this week, the expectation was for price to trade to the previous week's high and the previous month's high.
Why do I believe one specific draw on liquidity is more important—or more likely to be delivered to—than another?
That's exactly what I'm doing every single week.
Now we're going to shift our attention to the actual September NQ futures contract.
I've already done the work for you.
Here's July's high—the monthly high.
And here's July's low—the monthly low.
Then we have the previous week's low and the previous week's high. See that?
Now, with these levels marked, it's the same exercise.
When the September NQ contract opened, was it more likely to trade all the way down and take out the previous week's low or July's low?
Or was it more likely to take out the previous week's high and/or July's high?
Clearly, those upside objectives are much closer.
Based on price action alone, the higher-probability draw is into those highs.
Now, even if price were to reach those levels and then crash next week, I'm not saying that's what's going to happen. I don't know yet.
I need to see where we open on Sunday, how price trades through Sunday, and how Monday's opening range develops. That's what I'll base my analysis on.
But simply from where we opened, it's more likely that price trades to those upside levels.
And that's more than enough range to produce an excellent trading opportunity.
Don't look at last week and think, "That's just a tiny move. What's the big deal?"
It’s important to recognize how simple these ideas actually are.
The reason there are so many videos and so many individual teaching points is that I’m answering thousands of questions that have accumulated over time.
We have the previous month's high and low, along with the previous week's high and low, marked on the chart.
Now I'm going to focus your attention on a few things from last week's trading.
At this point, we don't need to concern ourselves with the previous week's low or the previous month's low. They're not relevant right now.
Let's move out to the daily chart and establish a few more reference points.
Again, we're using the September NQ futures contract.
When price was trading here, we had Friday, Thursday, Wednesday, Tuesday, Monday, and the prior Friday's close. Here's last Friday's daily range. Here's Thursday. And here's Wednesday's high.
Now, if price were to take out Wednesday's high, what PD Array—or PD Arrays—would likely become the next draw above the previous week's high?
The first candidate is right over here.
We've already talked about this. This area is too smooth.
Really, really smooth. The market doesn't like leaving price that smooth. It prefers to make it jagged. And that's exactly what happened.
On Thursday, price traded right through this area, cutting through these candles before eventually reaching this high.
If price continues higher, what's the next reference point for resistance? That high.
But before we get there, we have to cut through the chaff. Right here.
We have the low of this candlestick and the high of this candlestick.
That's a SIBI—a Sell-Side Imbalance, Buy-Side Inefficiency.
It's an inefficiency because price cut through the candles, and that's what the algorithm tends to do. We also have this wick. From where price is trading here, it's a premium wick. Then the next day opens.
I'll come back to all of these levels in a moment, but the market is likely to trade up to the previous week's high.
Then, if price continues higher, it's going to clear out these relative equal highs.
If it keeps advancing, the next reference point is this wick. It's a premium wick.
What makes it premium? Because at Wednesday's close, price is still below it.
So if price is going to continue higher, that wick becomes a premium PD Array.
It's treated just like a gap—just like this one here. Then we have this inefficiency.
By grading these wicks, we derive their consequent encroachment levels.
And look where the market trades. Right up to it. Look at the opening price. Isn't that crazy?
We have a buy-side imbalance, sell-side inefficiency here on the daily chart.
There's a volume imbalance at the low, but not at the high.
Then, during the previous week—not the week we just closed—the market traded down into this inefficiency, rallied, and then began consolidating.
Notice that when price retraced into this buy-side imbalance, sell-side inefficiency, the low never actually touched consequent encroachment.
It failed to glad hand with consequent encroachment.
Glad handing is the pairing of orders that allows transactions to occur at a specific price level.
When that doesn't happen as the PD Array initially forms, it's telling you something.
If the market is bullish, the upper half of the gap is where smart money buyers are most likely to be active. That's the strongest part of the gap.
When you see price begin its rally from the upper half and continue higher, it's confirming bullish order flow. No gimmicks required.
Everything is visible in the open, high, low, and close of the candlesticks. Very simple. It's free for everyone to see.
If price can't even touch consequent encroachment, that's an even stronger sign of bullishness—especially when no candle bodies close or become buried below consequent encroachment.
That tells you there's no unfinished business down here.
A bullish market should leave inefficiencies open.
Price rallies out of that, and then look at what happens here. Thursday. Friday of the previous week. Then Monday opens below this candlestick's close, which is the Rejection Block.
So we're creating this little area that's essentially saying, *I'm not willing to trade above that. *Why? What's going on? I'll get to that.
Then price trades softer on Tuesday. Now look at what's happening here. Look at this right there.
More importantly, look at what it's not doing.
The low of this candlestick on Tuesday failed to trade down to the high of the buy-side imbalance, sell-side inefficiency—which is the low of this candlestick.
So let's take a closer look at it. So on this Thursday, how could we know it was likely to become a large-range day?
Because it was the final major news day of the week.
PPI was being released, and we were heading into the final trading day of the week—Friday.
Up to that point, we still hadn't closed above this Rejection Block.
Price had spent all this time consolidating.
Then, on Tuesday, we got a subtle clue.
Price failed to glad hand with the low of this candlestick, which is also the high of this buy-side imbalance, sell-side inefficiency. So we have two things. Two themes.
Two confirmations that bullish order flow is still intact.
What's actually happening is that the algorithm is preparing to displace higher.
That gives it permission to trade into the previous week's high, the previous month's high, and then the other PD Arrays I mentioned a moment ago.
But for now, let's zero in on one very specific point.
I said that Thursday—the candlestick being highlighted here—was the one to focus on.
here's a student here:
Loading post from X…
A preserved copy is ready if the original cannot load.
Do you think it's going to be a large-range day after four small-range days?
What's my answer? I do. I absolutely do.
And remember, I'm saying this at 8:14 a.m. on August 13th, before this move ever happened.
Loading post from X…
A preserved copy is ready if the original cannot load.
Before the PPI number is released, I'm already anticipating a large-range day.
Specifically, I'm expecting price to drop first, then rally and take out at least Wednesday's high. Think about that.
If price is going to behave this way, then I'm making it very clear—with no uncertainty and no ambiguity—that I'm looking for higher prices.
I'm teaching the principles and theory that I've explained ad nauseam for years:
how to determine the draw on liquidity, how to determine the bias, and how to determine where the market is likely to go.
Continuing on, we're going to drop down to the 15-minute time frame.
Now, when we begin a new week, we need to know exactly what we're looking for.
In my private mentorship, there are lectures in months 6 through 12 that cover advanced Smart Money concepts.
They're essentially roadmaps that explain how these algorithmic moves unfold and how to anticipate them. Now, why do I use the 15-minute chart? Because it's a bellwether time frame. It lets me see everything. It gives me the entire weekly range.
If I scroll out a little further and include the previous week's price action, I can identify the key levels and, sometimes by referring back to my notes, verify them.
On the weekend, I always review my notes and say, "Okay, I marked last Monday's Asian session buy-side liquidity pool as an important high. What was that exact price level?"
I want to make sure I wrote those levels down because, you know, I'm human. I can get distracted by my awesome wife.
So I like to go back through my notes and identify where the key points and pools of liquidity are relative to each session.
Not just the daily highs and lows, because those are obviously strong independent buy-side and sell-side liquidity pools.
There's also the high and low of the last three days. The previous week's high and low. The previous month's high and low. Then you can drill down even further intraday.
What was the Asian session's high and low?
What was the London session's high and low?
What was the New York AM session's high and low?
Then you have the two-hour New York lunch session.
What's the high and low of that range?
Every time you define one of these ranges, you also want to know its midpoint.
That midpoint is the equilibrium price.
Those are the levels I keep written in my notebook all the time.
And on the 15-minute chart, they're all laid out clearly for you.
Earlier in the week, I said I was interested in the 29,984 price level.
Those are these relative equal highs.
That just so happens to be Monday's London session buy-side liquidity.
Then, after Monday's trading, I did a short review—you can go back and watch all of them.
I pointed out these relative equal lows and said, hint, hint, price could trade down and take out that sell-side liquidity.
But did I mention anything below that? No. I did not.
Now watch that daily buy-side imbalance, sell-side inefficiency. See it? The upper portion of it, right here. Look at what's happening.
Price trades down but falls short of touching it.
Is that bullish or bearish?
That's absolutely rock-star bullish.
Once these lows are taken out, I'm thinking price could trade down and touch that buy-side imbalance, sell-side inefficiency.
That's why I never gave a precise indication of how far it could trade below these lows.
But I never gave you any objective lower than these levels. What does that tell you? These lows are going to be swept.
They're going to take that sell-side liquidity while remaining bullish, and price can't even touch the buy-side imbalance, sell-side inefficiency.
That's exceptional bullish order flow.
You don't need to know how many people bought below these lows. You don't need to know how many orders were executed. You don't need any of that.
Then watch how price rips higher and uses a good old-fashioned ICT Bullish Breaker.
Look at that. Beautifully. Now price rallies into these inefficiencies, trades there, and continues higher. Where's it going? What could it possibly be reaching?
We have Monday's New York AM session buy-side liquidity.
There's also this level right here. This is Tuesday's liquidity pool. What is it?
It's Tuesday's AM session buy-side liquidity. Look—I even highlighted it for you down here. See that? I'm saving you some time.
So you're trying to tell me it's really that simple? Yes.
It doesn't require a bunch of acrobatics to determine where the key highs and lows are or where the market is likely to draw.
It's based on session highs and lows, previous highs and lows, and the highs and lows of the last three days.
That three-day range is dynamic—it constantly evolves. But you also have static highs and lows, which are session-based, like the ones I'm showing you here.
Then you have the previous day's high and low, the previous week's high and low, and the previous month's high and low.
By comparing where price is in relation to those levels, you can determine the most likely draw.
The higher the time frame, the stronger the draw tends to be.
If the objective is an old daily high, there's usually a great deal of institutional sponsorship behind the move from where price is now to that level.
In other words, it has rocket fuel behind it if you're expecting price to trade there and run through it. This also creates relative equal highs.
So once price took this high, it became reasonable to anticipate that this high would be taken next, followed by this one.
I typed 29,894.
Well, that's not very useful because price was already in close proximity to that level.
Loading post from X…
A preserved copy is ready if the original cannot load.
Loading post from X…
A preserved copy is ready if the original cannot load.
I'm giving you specific levels for a reason. Just like I gave you these relative equal lows and this level here. These were the benchmarks.
Think of them as bookends, boundaries, or perimeter lines that the market was likely to respect until we reached CPI on Wednesday and PPI on Thursday.
After that, we had to wait and see how the market would respond. But I had a bullish inclination.
I believed the market was going higher, and I made that very clear. I showed it. I said it. Now, that's not a signal service. But many of my students understand that little nudge. They know I'm going to focus on reading the tape with a bullish bias. And here it is.
So the question becomes:
What did you use to arrive at this conclusion?
How did you know it was likely to happen on the specific days you identified?
How do you know when it's likely to happen?
How do you use the economic calendar?
Think about it this way:
The economic calendar had CPI on Wednesday.
In your notes, pull up the economic calendar.
Go back to the week we just closed, Monday through Friday, and mark all of the medium-impact and high-impact news events.
The economic calendar showed CPI on Wednesday at 8:30 a.m. Eastern Time, followed by PPI on Thursday at 8:30 a.m.
Then on Friday, we had consumer sentiment and a few other medium-impact releases, but compared to CPI and PPI, those were basically a nothing burger.
They're not going to carry the same weight coming right on the heels of those two major releases.
So now let's strip everything down. We're down to the bare framework.
This is the entire week, all the way through Friday at 9:00 a.m. Eastern Time.
What did price do at 9:00? It took out this high. See that?
We rallied up, consolidated, and then rallied again.
Now, what day of the week is this? You have to know the extraction point.
If you're going to be a sniper, you go behind enemy lines, set up your hide, take your shot, eliminate your target, and then you have to know when it's time for extraction.
Where are you supposed to be when it's time to leave the battlefield? Where is smart money going to exit? That's what I'm getting at.
Where does smart money leave the theater of war that begins at 6:00 p.m. Eastern Time on Sunday and ends at 5:00 p.m. Eastern Time on Friday? Where is their extraction point?
Many times, it's what I teach as TGIF—Thank God It's Friday.
It's simply the idea that during bullish weeks, the market often trades off from the intraweek high and settles somewhere around 20–30% of the weekly range before the week closes.
You can use this as a trade idea, and I'll illustrate it in a moment.
For now, just understand that once price takes out this high and starts breaking lower, the key moment comes when it breaks below this low.
Notice the time frame we're using. It's the 15-minute chart. It's a bellwether time frame.
If you're going to study or apply TGIF, this is an excellent chart to use.
You don't need to go any higher than the 15-minute time frame.
You'll see everything you need. You'll see the entire lay of the land. Look what happens.
The market trades down to 30% of the weekly range.
I simply divided that range in half by adding the 0.25 level, which gives me the midpoint of that lower portion.
That's the level I'm personally interested in because we're in a primary bull market.
I felt very strongly that price was going to take out these relative equal lows.
But I wasn't looking for a full run through this buy-side imbalance, sell-side inefficiency (Suspension Block +) that isn't highlighted.
You can see the volume imbalance at the top here.
There may also be a volume imbalance inside this area, but I can't tell for sure—my old eyes won't let me focus on it.
The main point is that there's an inefficiency there that could lead to lower prices.
But I'm not looking for that because it would be going against the primary bullish manipulation this market has been under for the past year or more.
Once we took out this low, these downside objectives became the likely draw. Why?
Because on Fridays, after a bullish or bearish week, the market often retraces from its extreme.
In a bullish week, it typically trades off the high and pulls back into the weekly range—from the weekly high down to the weekly low, which in this case is the run below those relative equal lows.
Now, what did ICT show you again this week? The weekly high and the weekly low.
Do I always have to buy the weekly low or sell the weekly high to take a trade? No. I don't.
Now let's add a little more detail.
For those of you who never had the opportunity to go through the actual teachings from my paid mentorship behind the paywall, I used to have a whole legion of students from around the world learning with me. I don't do that anymore.
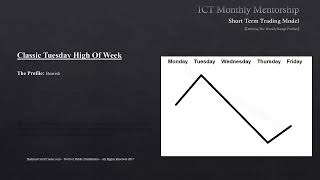
This comes from the ICT Monthly Mentorship, specifically the Short-Term Trading Model, Month 7 of the 2017 Mentorship.
ICT Mentorship Core Content - Month 07 - Short Term Trading Defining Weekly Range Profiles
https://youtu.be/wFjeUzJys7w?si=YTXV2uvHQCYwk5_z
I was teaching Weekly Profiles. Now, when you hear the word profile, don't say, *"See? I told you he uses Market Profile." *No, I do not.
I profile the market before it even trades.
Before your Market Profile tools populate those little horizontal volume histograms, I already have a framework for what I expect the market to do, where it's likely to trade, and how it's likely to get there.
What I've covered here is exactly that.
I told you to look at the economic calendar.
I told you to look at what we covered at the beginning of this video—where price was likely to draw and what it was not likely to do.
It wasn't likely to trade lower. It wasn't likely to take out the previous week's low. It wasn't likely to target anything other than buy-side liquidity.
Is that bullish or bearish? That's bullish, baby.
Now we have the next piece of the puzzle—the economic calendar.
On which days of the week do the high-impact news events fall?
It just so happened that CPI was scheduled for Wednesday at 8:30 a.m. New York time.
And you knew that months in advance, just like you already know the dates for the next several months. Go look at the economic calendar. Project it forward.
You can plan for these events ahead of time, just like you know when the Super Bowl is going to be. Well... if you're smart money, you already know which teams are going to be in the Super Bowl.
The point is this: I have profiles.
They're essentially weekly schematics for how I expect the market to deliver.
Think of them as roadmaps. This is mapping.
When you're mapping, you're anticipating specific events to occur on specific days of the week.
Now think back to what I just showed you with the economic calendar.
On Wednesday, we had the CPI release, just as we did this past week.
I told you there would be very reasonable price swings to trade on Monday and Tuesday.
Then Wednesday arrives, and the carnival ride begins at 8:30 a.m. with the CPI release.
It continues into Thursday because that's when the PPI numbers come out.
Then Friday brings only medium-impact news drivers.
Now, if we compare that to this schematic from 2017...
I am Enigma. Enigma is speaking to you. I'm explaining what my algorithm is going to do. I'm showing you how it's going to unfold.
But most of you never spend enough time with the core content because you're intimidated by its length, the depth of the lectures, and the number of topics covered.
You're afraid of information overload.
And if your goal is to use it immediately, that's exactly what you'll experience.
But when you ask me questions like:
"How did you know the market wasn't going to take out those relative equal lows?" "Why didn't it take the sell-side from the previous Asian session?" "How were you so confident it was going to do this?" "Why did you choose that?" "Why did you expect that move?"
"What made you bullish this week?"
The answer is the same. It's all in the core content. You have to go through it once.
Then, after you've been exposed to it, the questions that arise—that's when the real learning begins.
You're not going to remember everything after one pass. You can't.
It's literally 30 years of experience compressed into videos that you already think are too long.
But nobody else is teaching you this with the same discipline. Fine—show me where this is in Wyckoff. Show me where this is in order flow. Show me where this is anywhere else.
The market starts here, rallies, forms an important low on Wednesday, and then what happens?
It rallies into the end of the week. Why?
Because something bullish develops between Tuesday's close and Wednesday's session.
I've already outlined the technical reasons. I use the economic calendar to frame how the market is likely to trade. Look at what it did. Exactly that.
This profile is Consolidation → Midweek Rally.
Is that complicated?
If you're brand new, it probably seems that way.
But for those of you who've been here for a while—for a couple of years—you're probably looking at this thinking:
"It was there the whole time."
Every single week, the market does the things I've taught. Every single week.
All you have to do is spend some time with me. Just spend some time with me.
Mr. Wizard will blow your socks off every single week because this isn't going to stop working.
It's not going to fade away. It's not going to become another retail trading gimmick. It can't. It simply cannot devolve into the insufferable lunacy of retail trading.
I’m literally showing this to you publicly every single week. So why are you still sitting on the fence? Why are you doubting? Why aren’t you studying?
You’re robbing yourself of the opportunity to become as good at this as your own mind, body, temperament, and available time will allow.
You’re the one holding yourself back. I’ve already taught these concepts.
You’re simply unwilling to put them to work because I told you from the beginning that it was going to be difficult.
Instead, you want someone to come along as the white knight and say:
“I watched all of ICT’s videos and condensed everything into five-minute lessons. Forget the rest. Just focus on this.”
But what they’re really giving you is the part that resonated most with them.
You then try to apply it without all the supporting concepts they learned along the way.
And they’re not going to include all of that because they want you subscribing to their channel or paying for their mentorship.
Eventually, you end up paying someone else to explain material that was already available to you.
I’ve even seen students say they would never run a mentorship, only to start one later. Why?
Because it’s easy money. It’s very easy to sell people the idea that you know something they don’t.
I want to encourage you to dig into the things I've spent my entire life formulating, deciphering, and, as I believe, receiving directly from the Lord.
Whether you believe in Him or not, I don't care.
These concepts continue to work every single week.
I'm not throwing a thousand ideas against the wall and then pointing to the one that sticks, saying, "See? I was right."
Common sense should tell you that's not what I'm doing.
I'm calling out very specific things, and then I'm executing on them.
I'm literally walking you through the process of knowing where the weekly highs and lows are likely to form through experience. You're not going to learn that just by watching my videos.
And you're certainly not going to learn it from some short training video made by someone who can't even do what I'm doing. They can't teach it because you have to go through the process yourself.
You take part of the information from here, part from there, and then experience teaches you how to put it all together.
There are other weekly profiles that cover very specific, generic models for how price is likely to react, what it's going to do, and how it's going to behave. You need to go through those lectures.
Many of you are asking me to teach something that I've already spent an enormous amount of time and effort organizing into a condensed, user-friendly format.
It doesn't feel user-friendly because you're trying to binge-watch fifteen videos over a single weekend. That's not the way to do it.
Anyway, let's finish this up. We're down to the 1-minute chart, and we're at the end of the week.
Price is trading up into that premium inefficiency from the daily chart I showed you earlier.
Right away, we're entering the final phase of Friday's morning session—the opening range.
There's the opening price. Regular Trading Hours begin at 9:30 a.m. Eastern Time. This is Friday.
We've already rallied and hit several upside objectives. From here, it's reasonable to expect a TGIF retracement back into the weekly range.
Specifically, we're looking for a pullback into the 20–30% portion of the weekly range.
That's what these levels represent—the 20% level and the 30% level of the weekly range.
You don't know which support or resistance level the market is going to validate. You don't know which one it's going to respect. I do. I know which PD Arrays it's likely to respect.
I know which liquidity pools it's likely to target. And I'm proving it to you every single week. Week after week. Year after year, folks. Year after year.
What I just showed you in this lecture is something you should be doing every single week.
Go through those weekly profiles every week. Classify the week that just closed.
Ask yourself, "Which weekly profile did this market follow?"
I guarantee you most of you aren't doing that. None of you are doing that.
And then you wonder why you can't recognize what's likely to happen in the future based on what you've seen in the past.
If there truly is an algorithm—if there really is a rhyme and reason behind the recurring cycles of buying and selling pressure—why wouldn't you study it?
See how silly it sounds when you dismiss that idea?
People act as if you have to be some kind of religious fanatic to believe there's order behind the market.
Yet they'll turn around and say the market is rigged and algorithmic. Well, there it is. I don't understand why you keep fighting that idea. Everything in the world is run by algorithms and AI now. Everything.
They're literally talking about letting AI assist with military decision-making. Think about that.
But there's supposedly no algorithm running this market? This giant casino? This giant Ponzi scheme? No way. No way, dude.
When they introduced circuit breakers, that was the first step toward adding artificial controls to the market.
And eventually everyone just accepted it. Nobody complained.
If markets are truly free and conditions are bad, they should be allowed to crash.
You should be able to sell at the highs and ride the market all the way down if it's a dead vehicle.
But we don't have free markets, folks. We don't. We have what I consider a Ponzi scheme that's continually being propped up.
Every week there's another excuse to support it and maintain the illusion that a rising market means a strong economy. It doesn't. Those two things are not the same.
But now we're crossing from Thursday into Friday.
Regular Trading Hours begin at 9:30 a.m. Eastern Time on Friday morning, right here.
If TGIF is going to occur, price is likely to draw down at least to this level—and potentially to the 30% retracement of the weekly range.
That's interesting because it would bring price back down toward the previous month's high, the previous week's high, and back into the previous week's range.
If price is going to retrace 30%, then the 9:30 opening price becomes important.
If we rally above that opening price, think in terms of the Power of 3 concept I teach—how the range high and range low are formed.
What range am I referring to? From 9:30 to 10:00 a.m.
The high is likely to form somewhere within that window. I know, I know—it sounds crazy. I know.
But watch what the market does.
Now, if price is about to run into relative equal highs—because we have a high very close by—this is how you manage it.
You're about to encounter guarded buy-side liquidity.
How do you know when the market isn't going to take out those relative equal highs?
I see many of you shorting into the market while those relative equal highs are still sitting there.
What should make you buckle your seat belt? The macro time. Most people don't believe in it. They don't think it matters.
But 9:50 to 10:10 is a major macro window. Why?
Because it occurs during the first hour of trading, within the first hour's dealing range, and around the close of the 30-minute opening range. I don't care what anyone else tells you.
Price forms a high here, then pulls back toward the 9:30 opening price.
From there, it could very well rally during the macro window and take out this high and then this high.
So I want to see if they're going to guard that.
If they do, and they guard it during that 20-minute macro window, you're not going to get the best fill. You won't, because you're trading into a challenging situation. Price could sweep those highs and then reverse lower.
I'm not in the business of going out there to take losses. My goal isn't to survive losses and still come out ahead. That's not how I approach the market.
Retail trading teaches you to think that way. It conditions you to believe that winning only 40% of the time is fine because you can still be profitable. That's not what I teach. Can someone with a 40% win rate make a lot of money? Absolutely. But you have to be exceptional at money management. You have to manage yourself within the model, and you have to be comfortable taking a lot of losses and getting knocked around.
I don't want to trade that way. My life's work has been focused on filtering out the processes that lead to those outcomes and concentrating on avoiding the problem areas altogether. That's a wide gap in trading education, and it's one that very few people have spent any time trying to solve.
I’m the only one out here telling everyone else they're wrong. And I have the receipts to prove it every week, every day—and it isn't going to stop.
Now, look at this relative equal high. I wanted to see price take out the 9:30 opening price on a closing basis. It does exactly that right here.
Now we have a high, a lower high, and another lower high.
On a Friday, when a TGIF profile can develop, we also have relative equal lows. They aren't visible on this chart, but I showed them to you on the 15-minute time frame.
With the likelihood of a retracement to 20% of the weekly range, and the week's highest high already in place, what are we likely to see? A breakdown.
If we measure this range—from this low all the way up to that high—that high forms at 9:48.
I'm measuring that range and grading it with the Fibonacci tool. I'm plotting the octant and quadrant levels. I'm not showing the highest high and the lowest low—that's what's missing—but everything else is here.
This is the midpoint, or Consequent Encroachment (0.5 Fib). If you look closely, see what's happening here?
We have a buy-side imbalance, sell-side inefficiency forming just before that Rejection Block is taken out.
You asked these questions, so don't complain about the answers. You're going to have to learn a few things.
"Rejection Block, bro. Why aren't you talking about Mitigation Blocks?"
I am. I'm just not stopping to point them out every single time they appear.
This Rejection Block is the highest up-close. Price rallies into it but can't close above it. That's exactly what a Rejection Block does. Go back and review Month 4—that's where I teach these PD Arrays.
Once I see that, I check a box. The market is now showing signs that it's likely beginning to fail.
The next question is whether price comes back and trades through this buy-side imbalance, sell-side inefficiency, turning it into an Inversion Fair Value Gap.
If the market is truly going to fail and move lower, I want this candlestick to prove it. It opens, trades higher, fails to reach the high of the gap, and closes back below it.
Is that bullish or bearish?
The way I teach order flow, that baby is bearish. Bearish.
And now it's also Silver Bullet time, baby. But that's not all.
We have high, low—and they just took out a low.
2022 Model, baby. I don't want you trading the 2022 Model because you don't know what you're doing yet, and you haven't done enough backtesting.
Until you get sick of seeing it happen over and over again in hindsight—because you've studied it so much—you shouldn't be trading it. You should not be trading.
If you don't know for certain how your model is going to form today, you shouldn't be trading it.
I know all of my models, and I know which ones are more likely to form on any given day. Some models simply aren't going to appear. For example, if we're in a continuation environment, I'm not looking for reversal models.
That doesn't mean I can't drop down to a 15-minute, 5-minute, or even a 15-second chart and use a reversal model while maintaining a bullish bias. In that case, I'm waiting for a reversal at a low or an inefficiency, and that's where the model works.
But I'm not saying every model I have works every single day. It's not because the models fail—it's because the market conditions aren't right for that particular model to excel.
Think about it like going to a dentist or a doctor. They have all kinds of instruments, and every tool has a specific purpose. There's a tool for every procedure.
It's the same with my models. Through experience, I've learned how to match the right model to the right market conditions, based on what I believe the weekly profile is going to be.
Again, the weekly profile is simply the schematic of how I expect price to be delivered over several days before the market has even traded. On the weekend, before the market opens on Sunday, I'm already studying those profiles and mapping out how the economic calendar could align with my PD Arrays.
I'm looking at how the high-impact news releases might drive price into those PD Arrays and build the weekly profiles—the little squiggly lines I showed you back in the 2017 mentorship.
And the good news is, there aren't dozens of bullish profiles to choose from.
So I wait and see. This candlestick does the same thing. Price trades back up to it, gives up the ghost, and comes back down. At that point, I'm comfortable.
There's a small fair value gap right here, but it's also a Suspension Block. I'm watching that, and I'm also watching this wick over here.
Why? Because there's a gap here, and to the left of it is the longest wick. That's where my focus is.** If I can get filled as close as possible to the midpoint of that wick—even if I don't get the fair value gap entry—that's fine, because at this point I simply want to be in the trade.**
I know it's likely to happen. I also know my stop has to be at least above the Consequent Encroachment here.
That's why I only go in with two contracts. You often see me entering with larger position sizes, but because of where this stop has to be, it only justifies using two.
Then it rolls over. Look where the candle bodies are. See that? They're sitting right at the Consequent Encroachment of that bearish Suspension Block.
That, my friends, is the classic ICT Silver Bullet—the one people claim doesn't exist anymore because, supposedly, "they changed the algorithm."
Once we take out this low—and we do right here—price drops lower. Wonderful.
The next candle opens, trades up, creates this wick, and stops right at the Consequent Encroachment of that wick.
I'm not treating that low as broken support turned resistance. I'm focused on the wick. Look at the reaction there, then watch the candle bodies do exactly what I teach order flow should do.
If the order flow is bearish, there should be no candle bodies closing in the upper half of that wick. Look at this line. The candle closes right there—not above it. Yes, price spread its wings a little here and a little here, but it's only doing two things: delivering the errant price action that briefly trades above the wick's Consequent Encroachment, and respecting PD Array #1—the Order Block's opening price change in the state of delivery—before rallying into it and then continuing lower.
I'm watching the candle bodies stay below this wick because, it's a premium PD Array. As long as they remain below it, that's confirming the bearish order flow I'm looking for.
Price consolidates for a while, then finally gives up the ghost and trades lower, reaching the low that marks the 20% level of the weekly range—the TGIF objective.
Now the next question is whether we can reach the halfway point. I'm aiming just short of it because I want the low-hanging fruit. That's what I teach.
I can teach you precision, but in the beginning, you shouldn't try to trade with precision.
Don't worry about trying to catch every last tick. Just take the big piece of the move right out of the middle.
Think about a turkey drumstick at Thanksgiving—or a chicken leg if you prefer. Most of the meat is concentrated on one side of the bone. That's how I think about PD Arrays.
When you're bearish, imagine holding the drumstick by the end with the least meat. The biggest portion is at the top, so price rallies into that premium area, consumes the "meat," and then trades lower.
When you're bullish, just reverse the analogy. The meat is now on the upper half. As the market drops into that upper portion of the drumstick, it consumes the meat there and then rallies higher.
See that?
The market breaks lower and trades to the previous month's high. I don't want to hold for that, even though I shared that level publicly in a tweet.
Why? Because I could still be wrong. Trump could go out there, sneeze, say something about the borders, or announce some geopolitical development involving the Strait of Hormuz—and suddenly the market reacts.
That's the new thing traders have to account for: interference and market manipulation. I don't believe his tweets are literally causing the moves, but they can be used as smoke screens for moves that were already going to occur.
Everything I'm teaching here will feel very different if this is your first exposure to it compared to someone who's been studying with me for a while.
Those relative equal highs are not going to be taken if everything I've explained is true. If we have an Inversion Fair Value Gap and it takes out a Rejection Block, the candle bodies tell me the real story. To me, the bodies represent the true volume. I don't need a wick to take out that high. I don't need that. That wick simply becomes a gap.
If price trades up into that gap—and that's exactly what this wick is—then the next question is: what happens afterward? If it does this, then it must respect the Inversion Fair Value Gap and move lower. That's exactly what it does. Two candles later, it trades down to the 20% level of the weekly range.
The wick here defends that level. It says, "I can't trade any higher than this," but it does rally back to the Change in the State of Delivery, which is part of my Order Block Theory, before continuing lower. From there, price trades through the previous month's high and then reaches the 30% level of the weekly range. That's TGIF.
In extreme cases, the market can retrace to 40%, but I don't put much emphasis on that. From my experience, especially with the volatility of recent years, if it's going to reach 40%, it's often going to go even deeper. Most traders aren't going to hold for that anyway.
The 20% level is a very reasonable, tradable objective. 30% is certainly possible, but I personally like to target the midpoint between them—around 25%. In this example, that also aligns with the previous month's high.
Now look at 10:11. "Do you only take trades during the macro times?" Here's your answer. The macro time tells me the move is beginning to unfold. I want to see price take out the low, gravitate toward the 20% level of the weekly range, and maybe—just maybe—trade back into the previous week's range and reach the 30% level of the current week's range, the week we just closed.
Entry was right here, and then right there is the exit.
Someone asked me—or mentioned—that they've been trying to trade the Silver Bullet, but they just aren't seeing the setups.
I already covered how I know when certain relative equal highs or lows aren't going to be traded because they're guarded liquidity. I'm looking for very specific characteristics. I also talked about entering outside of the macro time. In this case, I needed a little more confirmation before committing to the trade.
If the macro is already delivering and price is in close proximity to a PD Array, I'll take the trade inside the macro window. Here, I'm only one minute past it, and there's nothing wrong with that.
There's also nothing wrong with entering right here because that's an Order Block—a Change in the State of Delivery. Even though it's technically outside the macro window, it could have been a pyramiding entry if I wanted to build a larger position.
These executions, however, were simply two contracts in, two contracts out. My objective was the midpoint between 20% and 30% of the weekly range. You have to know your extraction point. You have to understand how smart money exits the marketplace. In this case, they're exiting longs up here, distributing into strength, and then the market rolls over and does exactly what I've been teaching—for free.
It's a labor of love, baby.
I hope you enjoyed this. I hope you found something insightful in it. Until next time, Lord willing—I don't know when that'll be—enjoy your weekend, and be safe.
Loading post from X…
A preserved copy is ready if the original cannot load.
Loading post from X…
A preserved copy is ready if the original cannot load.
Loading post from X…
A preserved copy is ready if the original cannot load.
Loading post from X…
A preserved copy is ready if the original cannot load.
Loading post from X…
A preserved copy is ready if the original cannot load.
Keep learning with us.
Get new ICT lessons, study notes and updates as we build V2.