
Case Study With NonFarm Payroll & NQ Futures \ August 07, 2026
And if you watched yesterday's price action after the morning session, I think everyone would agree—it was a difficult environment to trade.
Date: 2026-08-07
Loading post from X…
A preserved copy is ready if the original cannot load.
Loading post from X…
A preserved copy is ready if the original cannot load.
Loading post from X…
A preserved copy is ready if the original cannot load.
Loading post from X…
A preserved copy is ready if the original cannot load.
Loading post from X…
A preserved copy is ready if the original cannot load.
Loading post from X…
A preserved copy is ready if the original cannot load.
Loading post from X…
A preserved copy is ready if the original cannot load.
Loading post from X…
A preserved copy is ready if the original cannot load.
Loading post from X…
A preserved copy is ready if the original cannot load.
Welcome back, folks.
Happy Friday.
Today we're looking at the NASDAQ on Non-Farm Payroll Friday.
What I'm about to cover is not an invitation to gamble or risk real money.
I've repeatedly taught that if you're brand new or don't have much experience, you should avoid trading Thursday and Friday of the first week of the month.
You simply have no business participating during those sessions.
They're very challenging for inexperienced traders.
And if you watched yesterday's price action after the morning session, I think everyone would agree—it was a difficult environment to trade.
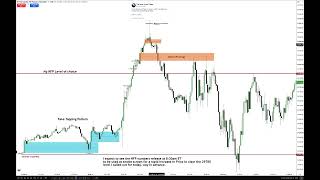
On Wednesday, I tweeted my final level of interest: 29,780.
That was the level I wanted to see how price would use going into Non-Farm Payroll.
During Thursday afternoon, price consolidated and built a range without showing much willingness to go anywhere.
That kind of behavior is typical heading into Non-Farm Payroll.
The pre-market session runs from 7:00 a.m. to 9:00 a.m. Eastern Time.
Today, however, we had a high-impact news event inside that window: Non-Farm Payroll at 8:30 a.m. Eastern Time.
That release, during the first week of the month, tends to produce significant volatility.
So we have to make a small adjustment to how we define the range.
For today, focus on the range from 7:00 a.m. to 8:30 a.m.
You need to know the highest high and lowest low formed during that period.
In this case, I’ve already identified them for you.
This is the highest high, beginning from the 7:00 a.m. start of the range.
What I’m measuring here is the lowest low and highest high.
That defines our pre-market dealing range.
We need that range established before 8:30 a.m., because a high-impact economic release is coming out and we know it can create significant volatility.
So when price behaves like this, we can anticipate a move lower, followed by a rally that creates a small inefficiency here.
And this is permissible.
These tiny excursions just outside the range of a buy-side imbalance, sell-side inefficiency are treated as a mohawk.
Now look at the bodies.
They’re not closing on the low or outside of it to the downside.
That tells you price is more likely to go higher—and it does.
Price then pulls back into this buy-side imbalance, sell-side inefficiency.
Each of these ranges is qualified by the key levels that define the dealing range, starting from the 7:00 a.m. pre-market session.
You can see this inefficiency touching one gradient level and another key level as well.
That makes it an important area to look for discount sensitivity.
And remember, I was already looking for 29,780.
So anything that builds the narrative toward that level helps.
Price trades into a buy-side imbalance, sell-side inefficiency, rallies, then pulls back into another higher buy-side imbalance, sell-side inefficiency.
The gradient levels confirm that this is a key area.
Price rallies again, pulls back into consequent encroachment of the gap, and the candle bodies fail to close on or below that midpoint.
Bullish or bearish?
Bullish.
Price rallies.
At 8:29 a.m., the candle opens, flirts briefly with the area, then quickly clears the lows here while leaving this sell-side liquidity intact.
Price rallies, pauses briefly, and then trades into the 29,780 level I had already identified.
It continues slightly higher, and then we enter the 8:50–9:10 macro window.
Price is also reaching an algorithmic projection during that period, which I’ll explain next.
So now the question becomes:
When is price likely to turn, and how could you anticipate that before it happens?
If you look at the tweet, I said that if you happened to have a paper trade running long in NQ, this was a reasonable place to take something off.
Loading post from X…
A preserved copy is ready if the original cannot load.
Why?
Because price had reached an area where it could reverse back inside the range during the macro window.
The move ran from 8:30 a.m. all the way into the beginning of the macro.
Then price broke lower.
This bullish suspension block was violated, which validated it as a bearish inversion fair value gap.
Price then traded back up into it, failed to reach consequent encroachment, and sold off.
Is that bullish or bearish?
Bearish.
Price then pulls all the way back down before rallying into a Balanced Price Range.
What makes this a Balanced Price Range?
A buy-side imbalance, sell-side inefficiency paired with a sell-side imbalance, buy-side inefficiency that share the same price range.
So I use the highest high and lowest low between those two inefficiencies to define the Balanced Price Range.
Price respects it here, then here, and finally gives up the ghost, rolling lower and eventually clearing out the sell-side liquidity over here.
I want to spend a little time on what happened around 8:29 a.m.
Price dumps into this area, then immediately opens and rallies.
When that happens, we can evaluate how price behaves once it expands beyond its initial draw.
In other words, how much further can it realistically extend?
Notice how price pauses.
So I go back and examine the range more closely.
I want to see if there are additional clues in the price action that project into this move.
Here I'm measuring the lowest low and highest high of the pre-8:30 range.
I'm applying standard deviations to that range.
The process is simple:
- Start at 7:00 a.m.
- Measure up to the 8:30 a.m. news release.
- Identify the highest high.
- Identify the lowest low.
Those two points define the range I'm working from.
With that measurement in place, once price clears my initial objective, the next question is:
How far can it continue?
We’re approaching the 8:50 a.m. macro, and price drives higher into a -2.5 standard deviation extension—well beyond the original objective.
Now we’re reaching an extreme expansion at a time of day where price could potentially reverse lower.
Why?
Because Non-Farm Payroll often delivers in two stages, similar to FOMC.
First, price rallies.
Then it reverses.
And what happens to the traders who chased the long?
Their stops become the next pool of sell-side liquidity.
Right here.
And you can see that sell-side liquidity being taken right there.
I wasn’t participating in that move, but all of the mechanics are visible in the price action.
The Balanced Price Range supports the bearish idea here.
Then we get a clean SIBI, and price trades back up into it.
Once we get that potential turning point during the macro window, we can take the Fib and grade the dealing range.
After price breaks below here and begins selling off, we start looking for qualified PD Arrays.
We anchor from the highest relevant point and measure down through the dealing range to the lowest low.
Now notice how each PD Array lines up with the gradient levels.
This area is qualified by the upper quadrant.
Price rallies into the Balanced Price Range and falls out of bed.
Then we get this SIBI, qualified because it sits on the octant just below consequent encroachment.
Institutional Order Flow Entry Drill—price sells off and clears the liquidity below.
Then price rallies again.
We get another buy-side imbalance, sell-side inefficiency, qualified because it aligns with this lower octant.
Another Institutional Order Flow Entry Drill.
Price rallies back to the 29,780 level, sells off again, and then consolidates inside this buy-side imbalance, sell-side inefficiency.
Then price rips higher.
It consolidates around the 0.625 octant, rallies again, and look at the candle bodies.
Do they breach that level?
No.
Price trades back up into the highest octant, then breaks aggressively lower and forms a bearish fair value gap.
Carry that gap forward.
You can see it right here.
Price hits it, sells off, and trades back down into the lower quadrant.
And that brings us to where price is sitting now.
All in all, this morning was a solid exercise in prediction.
This is everything I typed up once I got home.
Earlier that morning, while driving my son to an appointment, I took a screenshot and left my screens recording.
If anything had developed while I was away, I was prepared to enter remotely from my phone.
That’s why the version I posted on X was heavily compressed.
Now you’ll see the trade unfold in real time.
You’ll see the trade management, and then, once I got home, you’ll see how I annotated the chart and documented everything you see here.
That’s going to wrap this one up.
I hope you all have a great weekend.
I’m sure I’ll have something to say tomorrow.
Tomorrow, August 8th, is my birthday.
I’ll be 54 years old at 7:11 p.m. Eastern Time.
The old man’s getting up there.
I hope you enjoyed spending the week with me.
I hope you learned something.
I hope I encouraged you.
Lord willing, until next time—be safe.
Execution starts:
Keep learning with us.
Get new ICT lessons, study notes and updates as we build V2.