
Trading Premarket and Regular Session Liquidity - Sep 18, 2025
Date: September 18, 2025. ICT breaks down premarket and regular session liquidity, premium and discount sensitivity, and intraday sell-side targets in ES.
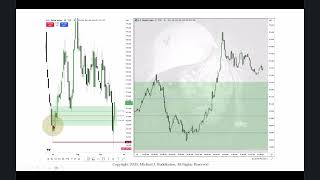
Date: September 18, 2025 URL: https://youtu.be/dA2CHAN1DzY?si=QFWPlY2Hyl9E3vi8
You need to be grading all of the premium and discount wicks on daily chart and use them as sensitivity places to understand the narrative.
We cut through the candles, it doesn’t matter if there is one day or five days between that candle and current price action.
Everything above these relative equal highs — all of this was retail getting trapped offside, and then they dropped it.
How did I know that? Because it was Thursday. Thursday is the day right before Friday, and the week ends since we can’t trade anymore after 5 o’clock on Friday. When we have a really bullish week, as we saw this week, it often creates either the high of the week on Thursday or fake highs that get blown out before the week closes, just like it did today.
I look for scenarios like this where the market is primed: retail sees resistance, they drop it down so traders think it’s going lower, then it runs back up and gathers all the buy stops left by those who shorted prematurely. All of these little runs are just accumulation of short positions, which then get traded down into the lower quadrant of that premium wick.
When price ran above this high, I was very interested in seeing it as a short. Why? Because we were heading into the 8:30 news injection, a time when volatility floods the market. That period is often marked by manipulation and smart money accumulating short positions, which are then distributed lower.
The distribution would offset at minor sell-side liquidity levels — at the pre-market session sell-side — with an expectation of lower prices, even on a day that’s primarily bullish. In those conditions, you must know exactly where you plan to exit. Otherwise, you’ll marry the idea and hold on too long.
This is the pre-market session start at 7am — the consolidation around the buy-side, where liquidity is accumulated. Then, right before the 8:30 news, they rally price up, taking out this short-term high and the one just above it. That’s exactly where I want to be selling short. Even if it stops me out by running higher, it doesn’t matter — it’s simply one of those times where you’re wrong.
Everything here was suggesting that because it’s Thursday, the market was being primed. Early on in London they set the stage, then at 7am they ran it up, but did not break lower, just kept holding it. As we approached 8:30, that was the cue for the next wave of price action.
At 7am we got the first run into the outlined liquidity. Then at 8:30 we saw a more significant intermediate-term price run intraday. After that, the market broke down, consolidated briefly, and eventually gave up, trading lower into the first minor sell-side liquidity pool. From there, it continued down into the pre-market session sell-side liquidity pool — which is exactly what I was targeting.
Time, then price, then liquidity. Where is it going to draw to? First minor sell side liquidity, and then down into Premarket sell-side liquidity.
Reclaimed FVG: This is time distortion inside of the fair value gap. Once price went above it and then dropped back below, it became a reclaim. It’s not an inversion fair value gap — it’s simply resuming its original characteristic at the point of formation, which is a SIBI.
where ICT went short
This is also an inversion fair value gap. Later, after the regular trading session opened at 9:30, price traded back up into it — showing exactly where I entered short. I added all my positions inside that reclaimed bearish fair value gap, and then the market broke lower.
Why didn’t I hold for this objective as I show here on the daily chart premium wick upper quadrant?
Well, it’s going against the underlying macro direction on the daily chart. So I know I’m trading against the grain, which means I want to stay nimble and take a low-hanging fruit objective to exit. That’s why I targeted the pre-market session sell-side liquidity pool — the low here. It’s the easiest and most logical objective to reach, a no-brainer. The reward was solid relative to the minor risk, and it was high probability. Expecting it to drop all the way down to the previous day’s levels isn’t high probability in this context.
Here’s the regular trading session start at 9:30. We had a minor sell-side liquidity pool at the relative equal lows, and a minor buy-side liquidity pool above.
At the open, price first dropped down — a fakeout — then drove up into the inversion fair value gap, trapping breakout buyers. Immediately after, it reversed, taking out sell-side liquidity and digging into the daily high (the dashed line) and the upper quadrant of the premium wick.
From there, rejection followed. Then the market gave a quick “sugar rush,” running right back above everything it had just taken, attacking the remaining stops — because the broader market is still bullish.
When we’re at all-time highs, avoid trying to pick the top. This was a textbook bait-and-switch: price retraced lower, tagged the old daily high, then rallied straight through to clear the liquidity resting above.
Notice these quadrant levels: price trades up into the lower quadrant of this BISI, which is the inversion fair value gap. That becomes the opening range high. From there, it drops down and hits the objective at the upper quadrant of the premium wick on the daily chart. Then it finds support, showing discount sensitivity at the premium wick high — Monday’s daily high.
This is the first presented fair value gap, marked with a volume imbalance at its high and a smaller volume imbalance at its low. Price trades through it, comes back down, uses it as a discount array, and then launches higher.
This range of the daily candlestick may look unclear, but on the lower timeframe chart, all of this is the architecture of that daily range being fulfilled.
Reclaimed SIBI from the earlier slides were used as +IFVG on this screenshot below
So what I’m showing you now inside this box, beginning at 10am when the market is bullish, is how the lunch macro will look for sell-side liquidity. The way to do this is to mark 10am and then move forward until you find the first prominent swing low since that time. That’s this one right here.
The lunch macro will seek that sell-side liquidity formed after 10am—the first obvious pool available. From there, we have a drive higher off the inversion fair value gap that takes out the buy-side liquidity. Then, as we approach 11:30am, the lunch macro algorithm pulls back into the range and seeks that sell-side liquidity.
So it’s the lunch macro, targeting both sell-side liquidity and the buy-side. Price first runs that buy-side, then trades up into this fair value gap. It reacts bearishly, hitting the consequent encroachment of that gap perfectly, before breaking lower. When we zoom in, you’ll notice a small inefficiency—a volume imbalance formed by this candlestick.
See that? Look closely. It’s not only the lunch macro sell-side liquidity pool and a clean retracement into the daily range, but from here all the way down you can see my ICT Market Maker Sell Model unfolding.
It’s the sequence: low → accumulation → re-accumulation → smart money reversal → low-risk sell → distribution → redistribution.
That second stage is the strongest leg—the best run lower—and it swiftly delivers into the standing liquidity or pending orders resting beneath that low.
US Dollar, as I mentioned last night, needed to trade higher first and then use the inversion fair value gap here (marked in green).
Look at the same quadrants I told you to have on your chart last night. At midnight, we rallied up and then dropped down—perfect delivery. Rise to the consequent encroachment, then drop lower. Colors outside the lines, accumulates with the bodies right here on that lower quadrant level. That’s the lower quadrant of the range between this volume imbalance and that volume imbalance, measured from the candlestick’s open to the candlestick’s close.
If you measure from this low to this high and apply your standard 0.5 level negative, you’ll project around this high as a swing target.
This is simply about looking at inefficiencies, measuring them, and viewing them the way the algorithm does.
EUR/USD chart
There’s a buy-side/sell-side liquidity purge there, and here’s a Venom. You have a single-pass candle up and then down, and then we trade back up into that candlestick right there. That’s Venom.
We have a fair value gap here that breaks down into consolidation. Measuring the gap, it breaks lower. Then we see an Institutional Order Flow Entry Drill — a gap with only one small candlestick popping above it, not even reaching the halfway point. Price then breaks lower aggressively, takes the sell-side, and trades down into the fair value gap between these two candles here.
Keep learning with us.
Get new ICT lessons, study notes and updates as we build V2.