
Market Review June 24, 2023
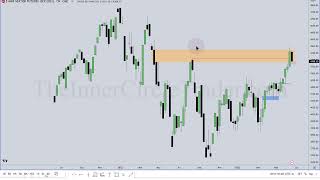
There is a fair value gap in here that has been left in place from last week’s trading, which is this weekly candle.
Date: 2023-06-24
URL: https://youtu.be/V0uV6lcgobQ?si=mgk17FI_NvUNZJno Watched Date: June 24, 2023
Here’s the Dollar Index. This is our weekly chart.
There is a fair value gap in here that has been left in place from last week’s trading, which is this weekly candle.
I want to see if we can keep this level in the form of resistance. In other words, it can go up here, hit it, and how we trade after going into it is going to be vital for me going forward.
Now, if we were to go above it and come back down in, I would expect it to act as support and maybe reach up into the rejection block, which is this high’s up-close price here, then eventually behind consequent encroachment of that wick.
But I want to wait and see what we get on Sunday’s opening, and I’m going to allow Monday’s trading.
Because there’s a lot of things happening around the world, and if you’re not paying attention, these things might surprise you.
So just check the news headlines, and you’ll see what I’m talking about.
But moving on into a daily chart.
I mentioned, when we were dropping, I said this is the area to watch.
We traded down into that on Thursday, right up into consequent encroachment of this wick right there.
So it's a wait and see. Sunday's trading Monday's trading, we keep our cards close. I'm not certain what we'll see. But could be pretty volatile next week.
Euro Dollar daily chart.
Okay, we have a weekly imbalance here. And you can look at that on your own charts.
I want to see, does this finally find its way above the weekly fair value gap and act as support.
There have been some issues with the crops from an agricultural standpoint, for folks that follow the commodity market, the grain markets.
Because there’s a drought right now, corn, wheat, and soybeans are expected to have a difficult year.
So that would be bullish for those grain prices.
And if that’s the case, that would probably be seen with a Dollar Index that is consolidating or lower.
But we have the added uncertainty of war.
Are you paying attention?
There’s a lot of things that weigh out.
So what do you do with this information?
When I see it like this, I stay to the day trading market.
I’m not doing longer-term analysis. I’m sticking to intraday trading, the sessions only: morning session, afternoon session, London session, that type of thing.
Hourly chart here.
You can see we ran above buy-side, shift in market structure here, right there.
And then we rally back up.
Is this 2022 Model? Is your entry then drilling down into an imbalance?
That would be your perfect 2022 Model.
If you look real close, you’ll see there is a SIBI with an order block.
There is some unfilled sell-side imbalance, buy-side inefficiency.
So for the bulls, you will need to get back above the weekly fair value gap, find some support, and rally.
Otherwise, we could see consolidation on the Dollar and make a run for Euro sell-side liquidity here, and dig in a little bit deeper on that weekly fair value gap that has just formed.
15-minute timeframe.
Okay, just a little bit more detail.
Nice SIBI after a shift in market structure there, after buy-side taken.
Imbalance, sell-off, Optimal Trade Entry here, and sells off again.
Breakaway gap.
What is a breakaway gap?
A breakaway gap is when we have a SIBI or a BISI in an area close to a swing high or low.
In this case, it’s moving lower. So in this swing high, this is an Optimal Trade Entry that you would look to try to get into.
Obviously, you would expect it to do what?
Drop.
So if it drops aggressively, that’s a very good signature. Something supports the idea that you’re on-side, and you don’t want to see that gap fill.
So you would treat it as a breakaway gap and the run down into.
E-mini S&P weekly chart.
So we had our inefficiency here.
We have this old high and buy-side liquidity.
We mentioned all these things should all be repriced up to the entirety of this SIBI.
And there is a volume imbalance right there.
That should be resumed going higher going into next week, or while you’re on that, will be the next draw.
Comparatively speaking, as I mentioned also, I want to talk about Nasdaq tonight.
But Nasdaq has, in fact, reached up into the equivalent of this volume imbalance on ES here.
Hourly chart on ES, and the chart is shown in regular trading hours.
Here’s that buy-side. We’ve worked all the way up to the upside for a move just outside of that old SIBI, which is the shaded area here. Then we broke lower.
Heavy volume imbalance in here, trades up just enough to get into the actual gap. This is a liquidity void, where it reopens and there’s no trading at all.
And then another opening range gap. That’s what you’re seeing here.
These are opening range gaps.
Opening range gap. Opening range gap.
So where we settle at, on the New York session, when you’re watching CNBC, they ring the bell and they clap their hands, that’s the equivalent. And then where we open up the following day at 9:30, that’s what’s being represented here.
That’s the opening range gap.
So whenever you hear me talking about that, that’s the concept I’m employing here in reference to time.
There’s an opening range gap here. Trade up into it, treat it once more as resistance, and sell.
Opening range gap for Thursday’s trading, and then Friday morning, 9:30 opening. That separation in there will be seen as the opening range gap, right?
So you can see.
Nice.
So opening range gap trades up into here on the 21st. We break lower.
We have an opening range gap here that’s not shaded, but extended in time, and see that we’re returning back into that.
Now, opening range gaps, I don’t like to take them beyond five days.
So in my opinion, they expire in five days.
Now, that doesn’t mean that you won’t find examples where the market has respected them beyond the limitations of the filter I’m saying I use for my analysis.
So five days after that, six days from this day, basically, I’m no longer interested in using that as a return back into it as support or resistance.
So I’m not treating it like a New Week Opening Gap.
New Week Opening Gaps, I can hold on to them and use them for months.
Opening range gaps and New Day Opening Gaps are short-term imbalances with an expiration date, and it’s five days.
So, you know, we had the market open, bounce around, and trade up into half of the opening range gap.
We have a 5-minute chart here.
See where we settled, where we opened, that range here, and 50% of that opening range gap is being noted here.
So we traded up to a short-term high in the morning session, traded back down to the low of the opening range gap, which is the opening price, 9:30 New York local time, regular trading hours.
You’ll see the separation trade down to the opening price at 9:30, and then rallies.
What is it going to try to do?
It’s going to reach for the buy-side here, and then try to work inside and reprice into all this opening range gap.
But we have a lot of order flow here and here, so it’s not necessary to do a complete closure.
I mentioned that I was interested in that daily fair value gap on ES.
I sent a tweet out on Friday morning, and I’ll show you that when we get into it later.
But right away, you can see how, from noon to 1:30, we ran buy-side.
And then the target, or bias, that I mentioned I liked for Friday, which was the discount fair value gap on ES, we actually traded into it by one tick.
Here’s the 12 p.m. to 1:30 p.m. New York lunch.
And I taught recently how to use this information.
If you have a bias, you think it’s going to be drawing to a specific higher-timeframe key level. I shared that with you on Twitter.
Friday morning, I said that I favored the lower fair value gap.
Loading post from X…
A preserved copy is ready if the original cannot load.
And you can see that on the ES chart. That’s what we’re looking at here.
So we ran up throughout lunch to take the buy-side.
Half of your opening range gap, between where we settled on the previous day and where we opened at 9:30 on Friday, measure that with 50%, it’s here.
It trades to here, consolidates one more time, runs into it.
Then we trade into the mean threshold of this bullish order block.
Notice how it was used here as support, runs up.
Once we trade below that low, every one of my PD arrays has an inversion application.
Everything acts like you would learn about in terms of support and resistance.
My ability to go into order flow, old market structure, and refer to very specific levels, things I’m looking for that are very finite, they’re not ambiguous. There’s not a range that you have to guess about.
So I want these things to have no required rules to adhere to, and you’re learning them as we go through this year.
So the market rolls back on anyone that was short in this big gap down. With electronic trading hours, you would see there’s a lot of movement from here to here.
Buy-side here, buy-side above some other highs in here that we don’t even need to look at.
But to eliminate all the guesswork, just get a range on that opening range gap.
It’s Friday. It’s likely to drop down into its daily fair value gap, which I’ll show you.
So it’s only a pullback to give a short-term in.
Then the market breaks lower, and then you get the typical run back down into the opening range gap low here, and then it trades into the low target, which is the daily fair value gap.
And again, I’ll show you what that is.
But you also probably noticed that you see some discoloration here.
For those that have been with me for this year, you already know what that is. That’s the framework with Silver Bullet, AM and PM session.
Here’s a 1-minute chart.
And you can see how that 50% of the order block and the convergence of the opening range, the dashed line is 50% of the opening range gap.
And this is 50% of the order block, or mean threshold.
So that’s what you’re seeing here.
So at 10 o’clock in the morning until 11 o’clock in the morning, we’re looking for a Silver Bullet.
I mentioned that I favored the lower end.
So bias, in my opinion, was bearish.
So I wanted to go short.
I showed examples of executing, working at the 9:30 opening, and it was like 75 or so handles taken out.
Loading post from X…
A preserved copy is ready if the original cannot load.
And you can look at that on Twitter.
We have a gap here to trade up into it, right there.
And at 11 o’clock, and a few minutes after, it’s still going a little bit higher, but that’s fine.
You can see on the 1-minute chart, there’s a little bit larger SIBI, which is a fair value gap. So it offers it there, but you would have been filled here.
And you’d have to have a little bit of drawdown.
Is that the rules for Silver Bullet?
Yes. You have to enter between 10 o’clock and 11 o’clock.
And if you’re very uncomfortable with that idea, then don’t trade that model.
And it trades down to the low end of the opening range gap.
So that’s almost about 10 handles.
We don’t need that. We just need five handles for a Silver Bullet. That would have offered it there.
Then we have the retracement going into lunch, running on buy-side.
And then we see, at 1:30, we have one more little trap move that takes us above the relative equal highs in here.
Buy-side is tripped and displacement is shown.
Short-term lows to a fair value gap, trade up into it, wait for displacement.
We’re at 50% of the opening range, and we’re at the old swing low, which is a down-close candle, bullish order block, and mean threshold level.
Okay, so that’s it.
This is where the market starts to work lower again.
Between 2 o’clock and 3 o’clock, we’re looking for an imbalance that we can use to enter on, to get in sync with the directional bias.
I’ve shared mine on Twitter.
So here’s the SIBI. Trade up into it between 2 o’clock and 3 o’clock.
There’s your PM session Silver Bullet.
What do you hold for?
Opening range gap low and a daily fair value gap.
So we had a nice run lower here, and then we dig below these relative equal lows, one tick into that daily fair value gap, and then retrace back up into the range.
Here is that fair value gap on the daily chart for ES.
I had this one highlighted, but I very specifically stated that I favored the lower as the bias on the day.
Drove down and one tick below that low right there, that was the delivery.
So 4381.75, 4381.50 was the printed level today. Measure the difference.
Keep learning with us.
Get new ICT lessons, study notes and updates as we build V2.