
Market Review & When Wrong Is Still "Right"
So you take that range, expand it to the right, and that would be your breaker. And I’m calling this a weekly breaker, but it’s inside of this range here. So I’m zeroing in on the daily chart to get inside of what this would be over the course of more than one week, obviously. But I’m looking at that daily candle right there. So from a weekly perspective, but not leaning on the weekly chart, that specific candle right there is what I’m aiming at and drawing it out in time.
Date: 2023-06-09
URL: https://youtu.be/qA9SCu4gGaU?si=xyhjUeMQY16Ygwcn Watched Date: June 9, 2023
I mentioned in the commentary on Wednesday that unless we take out that low and trade into this inefficiency one more time, I was going to hold on to a bullish bias for Dollar and bearish bias for Euro, trying not to pick tops and bottoms on a higher-timeframe chart.
So you can see the market did, in fact, aggressively move towards that low. No problem. I stated very plainly in Wednesday’s video that I’m not trading Forex.
I’m not here to try to make myself look like I’m always right. In fact, I was kind of hoping that the Dollar Index and the EUR/USD would do something contrary, so that way it sets the precedent going forward that you don’t have to be perfect.
And you can be right sometimes, but still be profitable. You can be incorrect sometimes and still be profitable. So that means being profitable when you’re wrong, and I’m going to kind of teach that as I go through this.
So the Dollar Index, on Wednesday, I mentioned that I would hold on to a bullish stance on Dollar unless we take out that low and trade into this inefficiency. Now, if we trade down below it and come back up, I would expect it to be treated as resistance, and then that would set the stage for a run into these lows. But I have to see if we’ll do that, obviously.
We have a breaker here on the daily chart. We have high, low, higher high, down-close. Came down here with the lowest close. Notice I’m not using this one; I’m using the lowest close. The volume, the narrative, the storyline is inside the bodies. The wicks do the damage.
So you take that range, expand it to the right, and that would be your breaker. And I’m calling this a weekly breaker, but it’s inside of this range here. So I’m zeroing in on the daily chart to get inside of what this would be over the course of more than one week, obviously. But I’m looking at that daily candle right there. So from a weekly perspective, but not leaning on the weekly chart, that specific candle right there is what I’m aiming at and drawing it out in time.
And I mentioned how we worked inside these levels here: the weekly mean threshold of the bearish order block. That’s this level here, 104.44. I mentioned the daily order block opening price here, so there was lots of work on that level. And then ultimately, we did, in fact, trade down here.
I’m interested in staying bullish on Dollar, bearish on EUR/USD, as long as we stay above this low. If I’m neutral, I’m looking to take new trades. But if it does trade down here, then that opens the door for me potentially conceding and saying, “Okay, this is probably much more meaningful.”
And if we come down below this inefficiency, I’m going to see it to be treated as resistance, and then any subsequent premium array that would set up later, like a fair value gap, something to that effect, or bearish order block, maybe a breaker, that could act as some premium array to send us into this area here.
So it’s kind of like my inner musing, the thing I’m considering as a potential future setup.
Here is the hourly chart. Here, we get down. On Thursday, we saw trading begin again, and we ran quickly down into that low and to this low here, so clearing out all the sell-side resting here. We aimed into that, and now we have, in my mind, potentially shifted bearish.
Now, I’m not convinced entirely. I want to see more evidence on a daily chart and get below this inefficiency and treat it as resistance. Okay, so I’m waiting. I’m predicting that as a future possibility in price action, the outlook for setups, if it does that. So it’s an if-then clause, okay? In itself, it’s algorithmic. If the market will do this, then I will do that.
But I’m predicting. I’m not reacting. I’m predicting that it will use this inefficiency that’s shaped here as a potential area of resistance and treat it as a premium array, and then look for that lower daily relative equal low where sell-side would be residing.
So it’s a condition for me to allow myself to sit still and relax and not rush to get into another new trade idea, which many of you need that skill set.
EUR/USD. And again, this is representing where we were at the time on Thursday, at this screenshot. So we worked inside this order block here, and it’s a weekly chart. So there really isn’t any inefficiency in this until we get up to here.
So if we see that further breakdown on Dollar, this will be the point of interest I would have on a longer-term for EUR/USD, unless this low is taken out. If Euro takes this low out, then we will resume looking for these lows to be taken, okay?
So based on what we saw on Dollar Index, on Wednesday’s analysis, I said that if we saw that low taken out on the daily for Dollar Index, then I would push my near-term bullishness on Dollar to the back burner, waiting for more developing conditions, potentially setting up shorting ideas for Dollar, which would allow for upside on Euro.
Now let’s just say, for sake of argument, say it trades higher and we get above this entry to support, that could be the catalyst that sends us up into this volume imbalance that never got traded to. Okay, so we can see one, two, three drives pattern that would eventually, much later in the year, become a factor.
Okay, so I’m just giving you some forecasting. I’m not stating that that’s the ironclad gospel that’s going to actually unfold. These are some of the ideas on how I look at this chart. I think it’s a weekly chart, so it takes some time for those things to develop.
Here is the daily chart of Euro, and we were meandering around in here. I said I would stick with the idea that we’ll see if it wants to go lower and have higher Dollar. And the higher Dollar did not manifest itself.
And I said I wasn’t sure if we go lower, if it needs to take out this high first. I didn’t know. So I was neutral. I was waiting for more information. It did, in fact, do that.
Here is where we take the context and apply it to the real mechanics of trading. There’s nothing wrong with having an expectation analysis. Like before you sit down and go to bed, you look at the charts and you think, “Okay, well, this looks like it may do this or that.”
So you’re predicting. You’re doing your analysis. You’re looking for a setup or a condition in the marketplace. If it meets that condition, then you’re assuming a trade position, okay, or incurring risk.
What we want to see form that gives us the framework for the trade has to be there in price. If it doesn’t manifest or make itself present in price action, there’s nothing to do. There was no losing trade. There was no missed opportunity for a short because it just simply didn’t manifest. It went the other direction. No problem. You’re going to have that, okay? You’re going to have that occur with you in your own analysis, your own trading.
And you can sit around and beat yourself up and say, “Oh, I should have did this. I should have did that.” Or you can say, “Okay, well, I’m glad that my system, my method, my conceptual ideas about how I’m reading and gauging price action kept me from taking a loss. Even though it didn’t give me the opportunity I wanted to see and participate in, I was not able to incur a loss.”
And there’s no ego harm. There’s no pride there. It’s flexibility. You have to be flexible as an analyst. The market is going to do certain things sometimes that you just don’t anticipate, and you’re going to get that part of it wrong. But the beauty is in not fearing that, because if you understand what I’m teaching you, my concepts, my setups, when they form, they’re actionable. But if they’re not presenting the framework, then chances are the likelihood of you having a loss is reduced.
Whereas if you just go out there and trade on indicators, or if you trade on some willy-nilly idea, or some black-box idea where it just constantly keeps throwing ideas at you that it’s a bias—so from my perspective, that’s complete randomness, and you’re going to be more prone to being victimized through that randomness.
Whereas we rely on price action to show us something to work with, and at the time of that Wednesday analysis and commentary, we didn’t see any displacement lower afterwards. So there’s nothing to engage here. There was no short that failed. There’s no short that manifested itself. So that way, you understand the proper context.
E-mini S&P, our weekly chart, and see, we did, in fact, trade higher on that weekly gap. And buy-side resides here. And outside that, we have this volume imbalance as well.
Nasdaq has already traded up into its secondary volume imbalance, but the S&P has yet to even take this high out, let alone get up into here. So S&P, unless it completely crashes, we’re going to maintain an expectation that we’re going to look for this high to be traded up into.
E-mini S&P daily chart here. You can see that we had this basket of buy-side imbalance, sell-side inefficiency. We traded down into that. I mentioned that it was likely to do something to this effect, where we would trade down and then run higher. And we did, in fact, take out those relative equal highs.
Let’s drop into an hourly chart. I’m taking your attention into this wick right here and the midpoint of that, which is consequent encroachment. And I said, let’s play devil’s advocate. Let’s assume for the moment that the S&P wants to go higher, if you hold that bias. Remember, I was saying on Wednesday, I was neutral.
So I was giving you an actionable plan of studies that we can go forward with, okay. Not to say, “Well, you know, the market could go up here or the market could go down here.” Because if you just listened to Wednesday’s video and commentary, and you walked away thinking that, you didn’t pay attention. You have to listen to what I’m suggesting to you.
Because if you are following this market, and your bias or your belief is that it’s going to go higher, I told you how to engage that. And it was at that 24 minute and 5 second time, and it’s this wick right here, midpoint of that.
Folks, this does not appear in textbooks, okay? It will now, because everybody’s going to start writing books on Amazon and everything else. And it’s going to be in mentorship now because you watched it pan out. But there’s still some things that you need, and that you just can’t look at it real quick. The question is going to be, how do you pick that wick, right?
Well, below this consolidation, this was that weekly gap low, and this is the weekly gap high. And I mentioned that there was buy-side, relative equal highs. There’s buy stops resting right up here. And I stated that I don’t like that retail sees that as resistance. I never like that. And that’s what I said in Wednesday’s commentary.
I stated that smooth edges like to be made jagged, okay? It’s an expression I’ve used a number of years, and this smooth area will be made jagged.
I mentioned that let’s assume for a moment and play devil’s advocate that the market does, in fact, want to go higher. It can drop down into this wick. That’s this one here.
Notice there is no inefficiency there. There’s no old high, no support/resistance, none of that garbage. Okay, it’s algorithmic. The market’s going to return right back to that price point. It means something to the algorithm. It’s a point of reference.
So the market drops down, clearing out relative equal lows. How far can it go down below those relative equal lows, Michael? To that wick, is exactly what I said at the 24 minute and 5 second mark in Wednesday’s analysis. It could go down here and then run higher to take out the buy-side.
This is what analysis, 30 years’ experience, and authorship in these concepts provide for you. That right there, it drops down just enough for the spread to engage that price. It rallies, short-term high taken, drops back down, and rips higher. Institutional Order Flow Entry Drill into this buy-side imbalance, sell-side inefficiency.
Rallies, falls short of this high and this high. Any retracement here is just going to set up a run to take out the buy-side. Any drop here is going to further increase the likelihood that retail traders are going to see that as strong resistance.
So they will want to go short here, if they haven’t already went short there. Where can they place their stop loss? Where they believe it’s protected and fortified behind this real strong, quote-unquote, resistance.
Well, we saw how that worked, right on through it like it’s nothing. This is a hot knife through butter. So we’re just knocking on heaven’s door, and hallelujah.
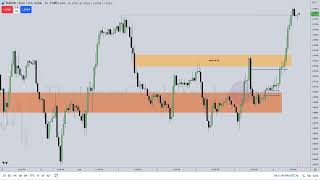
Here is the five-minute chart. You’re going to see a link in the comment section where you watch me engage, go right into the market, and trade the Silver Bullet trade for Thursday’s trading.
There’s a level, 1490.5, that I had in mind. I wanted to see it trade up into, but I wanted to use my limit order just below that. And there’s inefficiency right there that I felt was going to be impactful.
So you’ll see me wait for a short-term high to form, and then when that short-term high is ran out, I teach this to my students, which is running down equity when you’re approaching targets. And/or you get three-quarters of the way to a profit objective, and you’re bullish, anytime you make a short-term high and you run above that short-term high, you want to be taking partials there.
I don’t care what Tom, Dick, or Harry says in their dollar-menu mentorships. Partials always pay 100% of the time. There’s never been a partial profit taken that did not pay. It always pays.
So while you’re learning, I teach that skill set to traders that are learning how to find consistency and to encourage them to keep studying. If you go in with, “I’m only going to enter on this trade here, put my stop loss here, and I can only get out if it goes to my target,” you’re going to be very frustrated learning how to trade like that.
So I teach a graduated understanding with liquidity and trade management that works. It works, folks.
Loading post from X…
A preserved copy is ready if the original cannot load.
Keep learning with us.
Get new ICT lessons, study notes and updates as we build V2.