
ES Market Review May 17, 2023
Also, we have this down-close candle again on the weekly chart, and we have a new price level we’re using. Why am I using the opening price and the high of the candle? Because we have a short, stubby little wick. So whenever it looks like that, relative to the full range of the candle, I’m going to elect to use the opening price.
Date: 2023-05-17
URL: https://youtu.be/qiv8pkcNvGk?si=p7GmUtyBP1v6-SMK Watched Date: May 18, 2023
We have a discount fair value gap between this candle’s high and that candle’s low. That small area in there was delivered into twice. And we’re consolidating around a weekly imbalance, seen here with the volume imbalance, and then buy-side here if it gets extrapolated.
We also have Powell speaking on Friday at 10:00 a.m., so be mindful of that. I believe that is one of the reasons we’re seeing the market kind of waiting on bated breath to hear what the Fed Chair has to say. So that can be used as a smokescreen to move price.
Also, we have this down-close candle again on the weekly chart, and we have a new price level we’re using. Why am I using the opening price and the high of the candle? Because we have a short, stubby little wick. So whenever it looks like that, relative to the full range of the candle, I’m going to elect to use the opening price.
So we’re going to be looking for this weekly candle to expand higher, possibly reaching into this high here and then into the weekly volume imbalance. Since tomorrow is Thursday, we’ll be looking for Thursday and Friday’s price action to try to deliver that very thing and essentially repeat what we saw in the NASDAQ.
Be mindful of this blue shaded area with the order block. These levels are going to transpose into the daily chart, so don’t get confused.
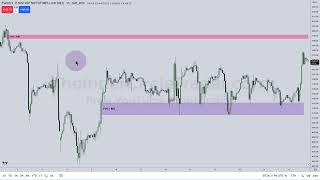
So here is that weekly order block level, along with the shaded area representing the weekly discount fair value gap. I mentioned that those two candles on the weekly chart were trading as wicks, and that is shown here through the daily candles.
You can see how the market has largely been holding inside of that area and reaching up into that premium fair value gap.
We also have relatively equal highs back here, which are residing inside that weekly volume imbalance. Specifically, that white shaded area around 4244 stands out to me as a draw. We may not reach it this week, but I do believe we are likely to trade up into this high sometime this week before the close. Whether we stay there and continue higher remains to be seen, but for now I am simply treating that as a draw on liquidity.
The H1 chart view gives you a clear sense of the ebb and flow of what the market has been doing, and why I’ve been focused on looking for buy-side to be taken.
The buy-side I outlined across all these highs here—I mentioned this in a tweet
Loading post from X…
A preserved copy is ready if the original cannot load.
showed that we were not really seeing any meaningful runs on liquidity, which means they were effectively stacking it up. So every time price kept going lower and lower, the market was likely going to use that liquidity later as a means of asset distribution.
So what is it offsetting? The longs that were accumulated at that low, that low, that low, that low, that low, and that low.
You may also be looking at these wicks here, along with the dashed line and the dotted line. What I’ve done is create the gradient levels of that fair value gap on the daily chart: the midpoint is that dotted red line, which is consequent encroachment, along with the lower 25%, the upper 25%, and then the high and the low, respectively, of that daily fair value gap.
These gradient levels are not Quarter Theory. The algorithm seeks these levels — these inefficiencies, which are fair value gaps — and it uses them with a great deal of precision. You can see how the market trades here, here, here, here, and here.
Look at the bodies. Then today the market rallies up into that premium fair value gap on the daily chart. It may consolidate and come back down a little into this area, but then I want to see it reprice higher into the 4200s. That is what I’m looking for. That is what I want to see.
Yes, it is a lot of movement, but we have Fed Chair Powell speaking on Friday, and he can put a lot of dynamite behind market moves. They like to use his words to fuel movement.
If you strip all of that away and break it down to where price has been, what it is reacting off of, and where it is likely to go next, that is what I’m seeing right now. So in my mind, for tomorrow and for Friday ahead of Chairman Powell’s remarks, that little fair value gap right there is important.
That is a fair value gap in the form of a sell-side imbalance / buy-side inefficiency (SIBI). In other words, the market only offered downside delivery there. To efficiently rebalance that area, price needs to reprice it, so the market should see it as a path on the upside.
Efficient price delivery is a pass above and below, or below and above — up, down, up, down. That is how you read price and efficiency.
You’ll see that we have a buy-side imbalance / sell-side inefficiency (BISI) up here, but you can also see that we’re respecting it, as well as this gap here. So just keep in mind that I’m not going to leave these specifically on my chart for the rest of this lecture, but you should keep them on yours.
We’re going to go into much greater detail on all of this now. If you drop down to the 15-minute timeframe, you can see how the market has respected those gradient levels on the fair value gap.
The way you derive those levels is by dropping a fib on the high and the low of any fair value gap—or any gap of any kind—and then highlighting the 50%, the 25%, and the 75% levels.
I’ll teach more about this as we move into the summer months, but for right now, this is enough for you to apply the method.
We’re going to go into great detail here and refine this to a much higher level of precision. And by doing this presentation, I’m also showing you exactly how I tell all my students to go back into old data and backtest.
My version of backtesting is not using a Forex tester or Market Replay. That is forward-testing practice before going into live data. It’s essential, and it has its place. But you also need to go back and study what price actually looks like as it moves, and go into great detail by annotating your charts the way I’m showing you here.
So for everyone asking, “Can you show us how to backtest?” — this is it. Go into the charts, annotate, and journal. That’s exactly what I’m showing you here.
I know there are a lot of different ways people journal, and I’m not going to say one is better than another because there are so many variables and options available. So do it the way that works for you.
Make it like therapy. Make it like a hobby that allows you to go into old data, study the details, and see how price delivered and at what time it delivered. By doing that—and by building sample sets from months and even years of backtesting and studying price action this way—your subconscious starts to retain it.
Because you see it so many times, it becomes like a pseudo-experience. And in those empty spaces on the charts, you want to annotate and almost cheerlead yourself, noting that you saw these things coming before they happened. By retaining that, seeing it in price action, and seeing it in your own annotations and journal entries—then reviewing it again on the weekend—your subconscious begins to retain that information as if it were real experience.
And it becomes positive reinforcement, because you are never adding anything negative to your charts. You do not want to fill your annotations with complaints about why you didn’t expect something or why you didn’t do something correctly. Always cheerlead yourself in your notes. By doing that, you train your mind not to fear the moves, and you also train it to recognize things you’ve already seen before through this process and procedure.
Dropping down to the five-minute chart, you can see how the market is, in fact, respecting that consequent encroachment, which is the midpoint between the high and the low of the daily discount fair value gap.
I promise you, once you start doing this on your own charts, you’ll begin to see things that repeat over and over again. This is simply showing you, conceptually, how the market respected these levels and to what degree of precision.
Dropping down to a three-minute chart — and this is how I teach my students — we refine from the 15-minute chart to the 5-minute chart, and then from the 5-minute down to the 1-minute. We keep refining the timeframes until we see the imbalances or the specific model we’re using.
Recently, I’ve been teaching my ICT Silver Bullet setup.
The morning session Silver Bullet is what I’m going to cover here.
But in passing, you can already see one up here — this is the PM session setup. We have a shift in market structure here, price trades back up into that fair value gap, and then drops down to attack the sell-side liquidity there. So for your notes and study, you can use that as your PM session Silver Bullet.
As for this setup, I mentioned yesterday and the day before that I was interested in seeing higher prices on ES, with the idea of it catching up to NASDAQ. I also sent out a tweet with a chart that identified each buy-side liquidity pool I believed the market could reasonably run up into and engage. What you’re seeing here is a more refined version of that, with additional detail, using the information I’ve already taught and discussed throughout the week.
We have a buy-side liquidity pool here. At 9:30, the market drops down — this is a Judas swing — and clears out this short-term low. Then we get a shift in market structure right above this short-term swing high there, followed by a fair value gap.
That all occurs between 10:00 and 11:00. We’re bullish, we saw the market drop down, and then trade into a fair value gap. This is a Silver Bullet long. If you buy here, using this candle’s low, and run it up to that high, does it offer 10 handles? Yes, because 4130 to 4140 is essentially 10 handles, and that still does not even reach this high here, which is above 4144 or so.
So the criteria are met: looking at this as a Silver Bullet into that buy-side, it offers a potential 10-handle range. That means you can be a buyer there and see if it reaches that objective — but you want to take profits at five handles, and that’s how I teach my son, Cameron.
Watch what happens after it takes buy-side: it comes right back down and runs the sell-side. So what is it offering? A stop run. Why would it want to do that? So smart money can accumulate new longs while trailing stop losses are taken out.
But what is price trading back down into? That daily discount fair value gap — and more specifically, the upper quadrant of it, the 75% level of that range, which in my framework is effectively revisiting consequent encroachment.
Look closer. This imbalance here—when price trades up into it—traders who think this is a liquidity void, or something to that effect, assume that it is finished there, that it has become balanced. It has not. That is not yet a balanced price range. It has only been repriced into an inefficiency. That’s all it has done.
When the market trades back down into the lower portion of it here, and then leaves the range based on what this candle does, it becomes a balanced price range because price has now been delivered to the downside, then to the upside, failed to go lower, respected the level, and then left the range. So it has acted as a trading range inside this one micro imbalance on the three-minute chart.
This candle’s high here is precisely that candle low right there. Not one tick short, not one tick off—exactly that price. And I encourage you to look at your own price data, because you’ll see that this is, in fact, true.
So when you see that, you can trust that if price starts to move higher, then we likely made the low of the day.
We’re down to the one-minute chart here, everything else being equal. In that balanced price range, I want you to focus on the range between 10:00 a.m. and 11:00 a.m. New York local time — always.
I want you to pay close attention to that little area right there on TradingView. When you’re watching real-time price data, your chart will generally be set to electronic trading hours by default, and it will look like that while you’re trading.
If you have live data and you’re paying for the live feed on TradingView, you can toggle between electronic trading hours and regular trading hours to see more detail. If you click that setting, it will give you the option to switch between regular trading hours and electronic trading hours. If you toggle it to regular trading hours, your chart will show the opening range gap — the difference between the 4:14 p.m. close of the previous day and the 9:30 a.m. open today.
That is the opening range. If there is a gap and we gap higher while we’re bullish, this is how you use that information: you expect price to trade back down into it, reprice the gap, and then move higher — away from the direction of the gap after it has been filled.
If we are bearish and we see a gap like this, then price can trade lower, fill the gap, consolidate, make a false run, and then break lower. Or, if we are in consolidation and have already met some higher-timeframe weekly objective, and we still open with a gap higher like that, then what can happen is that price simply wants to get fills and nothing more. In that case, it may just use that entire gap throughout the day.
But because we had a bullish framework, as I highlighted yesterday, this was a gap-higher opening that filled and repriced down into that Opening Range Gap well — which is where the previous day’s regular trading hours session closed. You can always find that price simply by toggling TradingView from electronic trading hours to regular trading hours.
It can be a gap higher like we see here, a gap lower, or it can be unchanged. We prefer to see some kind of gap because a gap always creates an inefficiency, and inefficiencies are often — not always, but often — repriced. How we use that information going forward is paramount.
What I teach is unique to me. Once that gap is completely repriced, if we are bullish, we can take that gap range and use multiplications of it to project higher prices. So if you take that range from the low to the high and project it upward, you can derive two standard deviations, which gets us very close to the high without even reaching that premium fair value gap in the pink area.
So in terms of my Power of Three, the daily range was defined at the 9:30 open. Price trades down first, which is the Judas swing. Retail traders will often chase that move lower because they are not aware of the inefficiency between regular trading hours and how electronic trading hours are hidden. When you look at a chart like this, there was trading beforehand, but now we are met with the opening range at 9:30. So at the opening bell—when all the initial volatility comes into the marketplace—we usually see this type of function, where price seeks to reprice back to the previous session’s close.
That is exactly what we see here. Price drops down, creates the low of the day, and then starts to trade higher. As soon as we meaningfully move above the opening price on this type of day—essentially swinging above this level—the market begins to run higher into a premium. What premium? The premium fair value gap that was shaded in the pink box at the beginning of the video.
I take you from higher-timeframe context down to lower-timeframe execution so you can keep track of what I’m looking at and why it is important. So essentially, what we are looking at here is my Power of Three concept: the open, the manipulation, the accumulation of longs, the distribution into a premium, and then settlement into the daily close.
So the Power of Three is shown here through the daily range, the classic ICT buy day, the Judas swing to reprice the Opening Range Gap low—which is down here—and also the daily fair value gap consequent encroachment confluence. That means price trades down into the midpoint of that daily discount fair value gap, which is here. Additional confluence is present as well if you want to factor in your New Day Opening Gap.
I did a video presentation about that on this YouTube channel just a few videos back. Go watch it, and you’ll see how you can use the New Day Opening Gap, which is also a component of this low as well.
There were many reasons why price went down there. A trader using retail logic would not be able to see all of the confluences I’m showing you here. Then you had the draw on buy-side liquidity that I pointed out on Twitter on May 16, which was yesterday, and the high of the day was booked at the daily premium fair value gap high.
When you have all of those details here—the high, the low, and all these factors coming together—it creates a beautiful tapestry of how the algorithm prices, reprices, redelivers, balances, and then seeks new liquidity.
That is essentially what you are doing when you trade with my concepts. You are trying to determine what the algorithm is likely to do next: move higher or lower. Why should it go higher? To rebalance an inefficiency or to take out buy stops. If it is trying to move lower, why is it going lower? To trade into an inefficiency or to take out sell stops. If it is not going to do either of those, then it is going to consolidate, range, and frustrate traders—which is basically what we’ve been seeing for a number of days now, and really for weeks if you want to zoom out.
So there is a lot of detail in this process and in the backtesting procedure. You go through all these little empty areas over here and fill in your observations. You want to kind of cheerlead yourself and note things like, “Look how the market respected this Silver Bullet, which is a fair value gap.”
We’re watching a one-minute chart now, so everything that was identified on the three-minute chart has been transposed to this one-minute chart.
You want to include everything you see and observe—everything. That way, you’ll have much more detail in your journal instead of just showing a few charts with a scribble here and a scribble there of useless information.
You really want to make this feel almost like a meditation. And yes, it takes a lot of time. Yes, it takes a lot of work and effort to stay organized and make your charts mean something to you. What you’re really doing is writing the most important and useful trading manual you will ever read. And you’re doing it with your own eyes, your own experience, your own annotations, your own charting, and your own snapshots of each individual chart and each respective timeframe.
There is no better trading book, journal, or instructional manual on price action than what you will be creating by doing this. That’s why it takes time—months, okay? And the more work and effort you put into it, the better you’re going to become at reading price action. This is the secret part of the recipe here.
Every one of my profitable students did these kinds of things. They went back and studied all the moves. They looked at every detail. They studied what time certain things occurred. What time did price reprice to the higher low of the day? They studied it from the higher timeframe, sticking with a bias, asking why price should move, why it should run to a higher low, why it should move higher, why it should move lower, and then staying with that narrative as they worked through the charts and looked at all the opportunities that presented themselves.
Over time, you will build a rich tapestry of reading price action through hindsight moves, and that will become applicable to the future price action you watch live. Every serious technical profession works this way—doctors, technicians, all of them. The people who now work in their practice or profession all trained through case studies that were already complete, already available in hindsight.
I use this analogy all the time: even surgeons practiced on cadavers. A cadaver is a dead body donated to science so that people training in medicine can study anatomy and perform procedures without any chance of harming a living person. The worst has already happened—that person has passed away. So when you’re trading in hindsight, when you’re studying with annotations, you cannot lose. It is all upside.
The only real downside is failing to take advantage of it—or writing negative affirmations in your annotations, like “I was stupid,” “I missed this,” “I did this wrong,” or “this doesn’t work.” You do not want to do that. What you want to do is cheerlead yourself. That way, when you read your journal entries later, they are in your own words, pulling out information you found in old price moves.
Then you map out each individual day the same way I did. And by doing that every single day, you’ll understand why I teach you to focus on one market—or two if they are closely correlated—but nothing more than that. You want to put as much time and energy as possible into studying one instrument, one market, one pair if it’s Forex, or one futures contract, and dig into it with rich, detailed study.
Because the same things I’m showing you here exist in Forex. They work in Forex, they work in commodities, and they work in futures. It’s not that these principles only work here or there. These principles are applicable to every asset class.
Keep learning with us.
Get new ICT lessons, study notes and updates as we build V2.